I decided to write this article as there are many and varied descriptions and interpretations of Lean Metrics. Some are just nuances and work fine; some are just plain wrong. In early books written by the Lean Thinking pioneers, including those from Toyota luminaries, certain terms were variously described which added to the confusion. Spellings also varied over the years in these various books. I urge you to decide on the appropriate metrics in your context and your own standardized definitions before using any of them.
My descriptions are those where I have sought deep consensus on from real experts I respect and trust, as well as those I have used for years during my time in Toyota where I learned my trade.
Remember: If you found this post useful and are not already a subscriber, sign up for the NEWSLETTER.
Value (NVA) and (VA)
Non-Value-Added (NVA)
Non-Value-Added activity or work is activity that is not adding any value to the work being done. (NVA) time is the sum of all time where value is not being created.
Value Added (VA)
Value-Added (VA) time is the sum of all time where value is being created.
Image 1 – Industry Definitions of Value

Note: Value is perceptual and is only measurable by those that receive the value. Value is only valuable if someone values your value. Once the perception of your value wanes so does your relevance and need to exist.
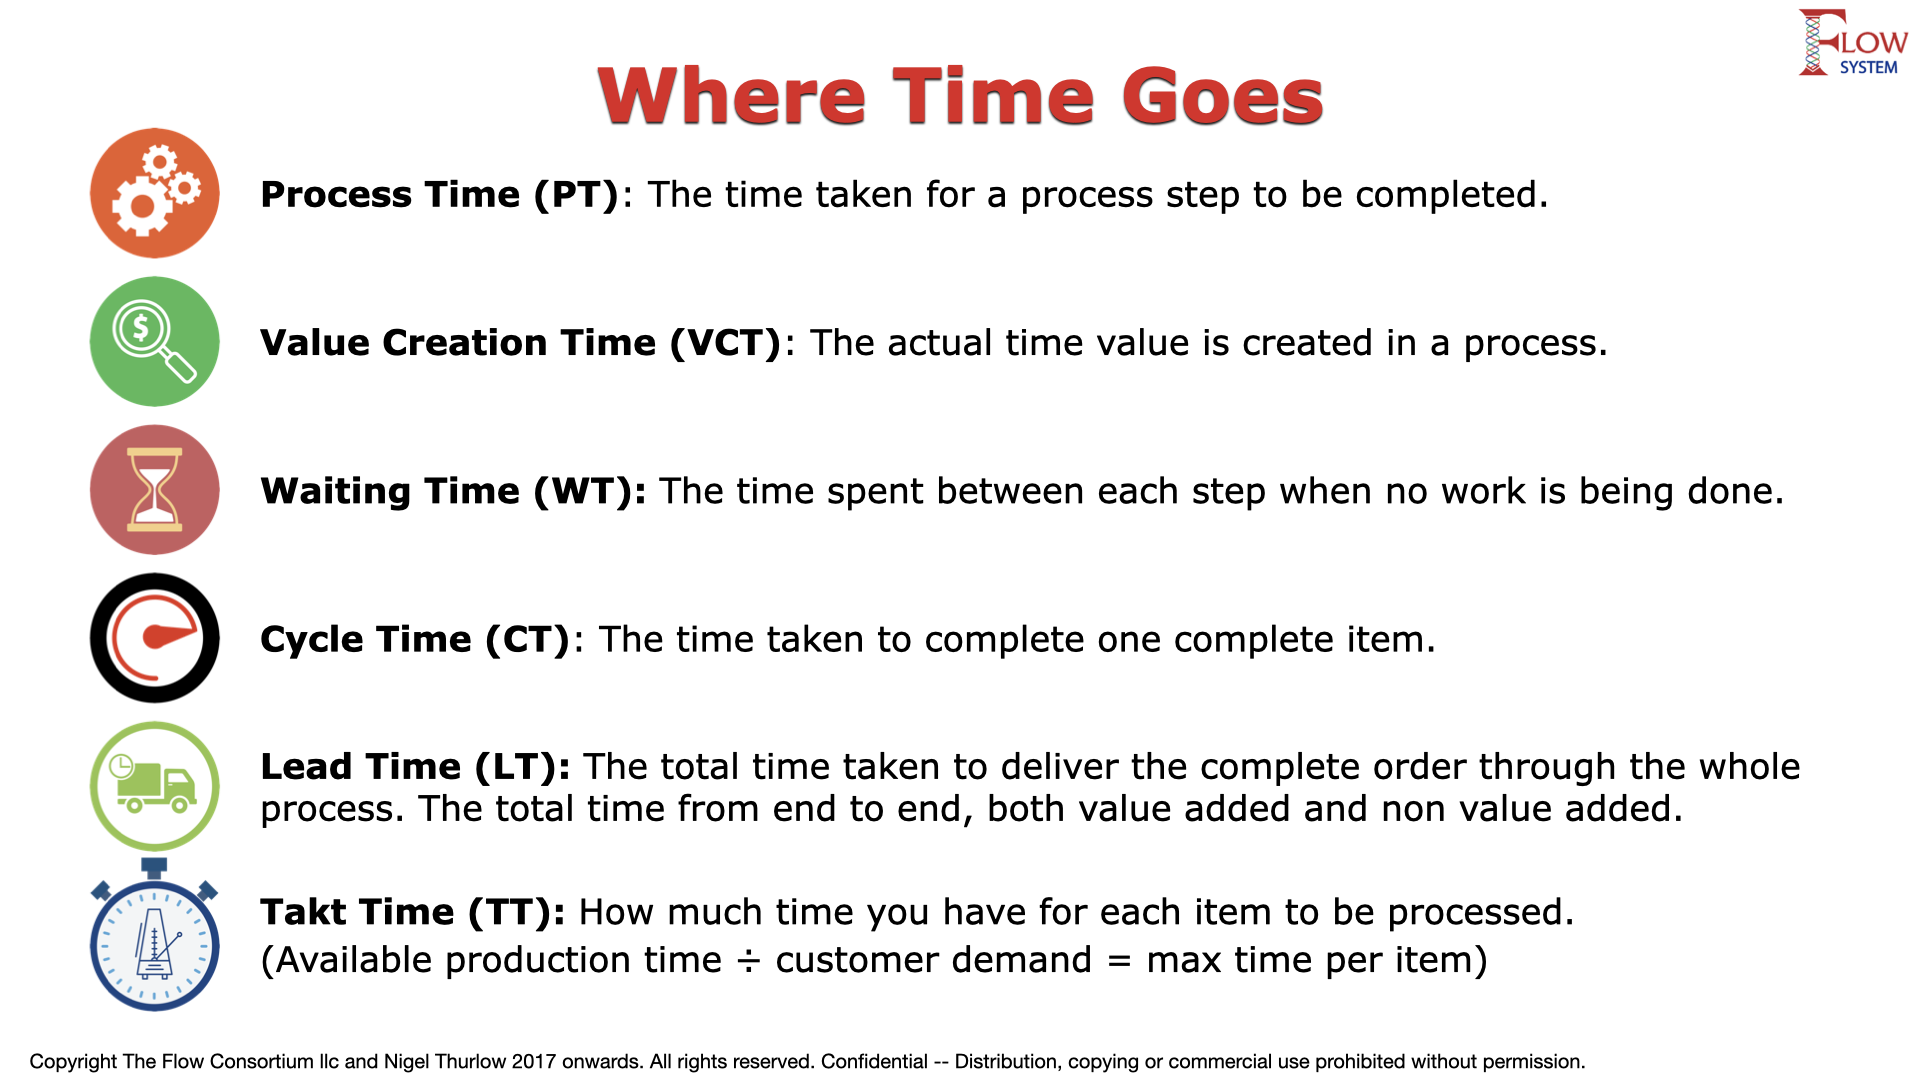
Waiting Time (WT)

.
.
Waiting Time (WT), also known as Idle Time, is Non-Value-Added time but is sometimes calculated separately as this is where most wasted effort is evident, and often it can be addressed the most readily.
I recommend you measure (WT) as separately to total (NVA) time. Measure both, but make (WT) distinctly visible so it can be more easily recognized and quickly eliminated. Don’t let it hide in among other (NVA) waste that is harder to reduce.
Summary – (WT) is the portion of (NVA) that is spent doing nothing, just waiting, whether it’s an item of work, or people.
.
.
.
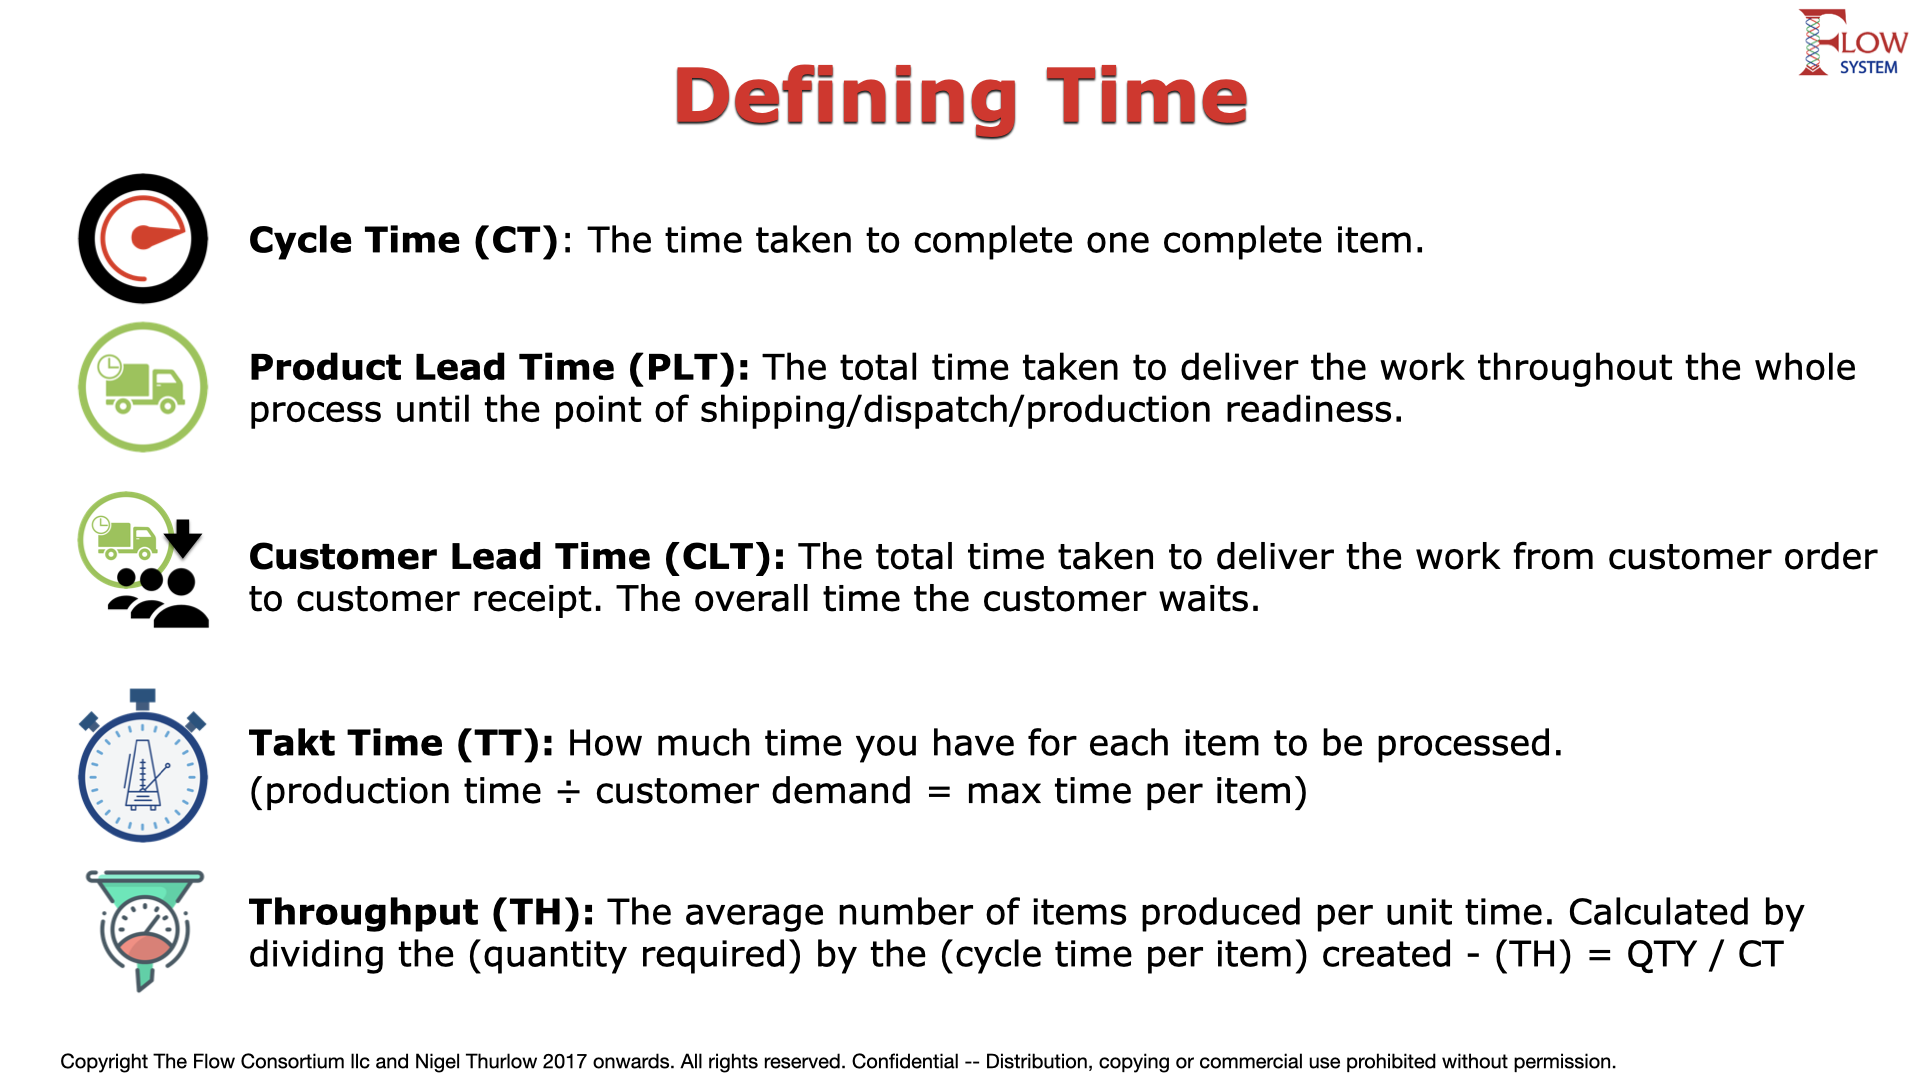
Cycle Time (CT)
 The most common metric used is Cycle Time, and this is the time taken to produce one item from start to finish.
If you are completing a customer order that contains 40 items, then CT is the time to make 1 item. In a factory however CT is used to describe the time taken to make a part.
Parts may also be combined to make sub-assemblies and be further combined to make what a customer would recognize as a finished product. All of these use CT as a metric to measure the time taken in each of those steps. This is where you will also hear the definition that CT is the time to make 1 unit or to compete one step in the process. Both are correct. Confusing isn’t it!
“Cycle time is the time allotted to make one piece or unit.” (Taiichi Ohno 1988 pg 22)3
“Cycle time, the length of time (minutes and seconds) in which one unit is to be made;”. (Taiichi Ohno 1988 pg 128)3
Adding to this confusion when talking to my friend and Lean expert, Charlie Protzman, he also says for him in manufacturing Cycle Time is “how often you get the part off the line”. If you think about this for a moment this is really saying the same thing. How long it takes to make one item; that’s the item coming off the line. He also says in manufacturing they also call this Throughput or Lead Time, which in my view is completely wrong, and you’ll see why later in this article. The conflation of Lead Time and Throughput is a real error once you are measuring knowledge work.
Summary – (CT) is the time taken to complete one item of work.
Takt Time (TT)

Takt is a German word and is the white baton the conductor of an orchestra uses, the takt. It is taken to mean rhythm time and in Lean it means the time available to meet the customer demand. It is the time allowed to produce one item per unit time.
Example: The customer wants 40 contracts processed in 1 week. There are 40 hours in our working week, so the Takt Time per order would be 1 hour. Each contract should take on average no longer than 1 hour to complete. All 40 contracts would need to be completed in 40 hours to meet the customer demand. TT is calculated by dividing the desired delivery time by the number of items desired or available time divided by customer demand. 40 hours / 40 contracts = 1 hour per contract.
In early books on TPS the creators sometimes mixed the terms Takt Time and Cycle Time, also spelling Takt as Tact. The latter may just be bad translation or a simple typo in early books.
“Cycle time, or tact, refers to the time it should take to manufacture a single item. This is determined by the production quantity, in addition to the required number (namely the number of products needed in a given hour according to market demands) and the operating time. The required number can be calculated by dividing the monthly number by the number of working days. Cycle time can be calculated by dividing the operating time by the daily required number.” (Ohno and Mito 1986 pg 82/83)2
As you can see the term Cycle and Tact (sic) is used to mean the same thing. While this is not how we define things today there is a situation when they do become synonymous with each other as I will explain. Takt determines demand. When you are meeting demand your Cycle Time and Takt Time are the same. This is only coincidental and is not meant to suggest you should interchange the terms but is presented here so you understand the confusion should you ever encounter it.
Using this description “dividing the operating time by the daily required number” if we need those 40 contracts in a week and we work for 5 days, but our daily operating time is only 3 hours then the takt time per contract would be 22.5 minutes. Remember, the customer demand is for all 40 contracts in 1 week; that’s 8 contracts a day takt time. So, 3 hours per day = 180 minutes / 8 contracts per day = 22.5 minutes.
Summary – (TT) is the time you have per item to ensure you meet the total time the customer expects all items to be delivered in.
My friend John Shook says the most important thing to do is “Take Care of your Takt Time”.
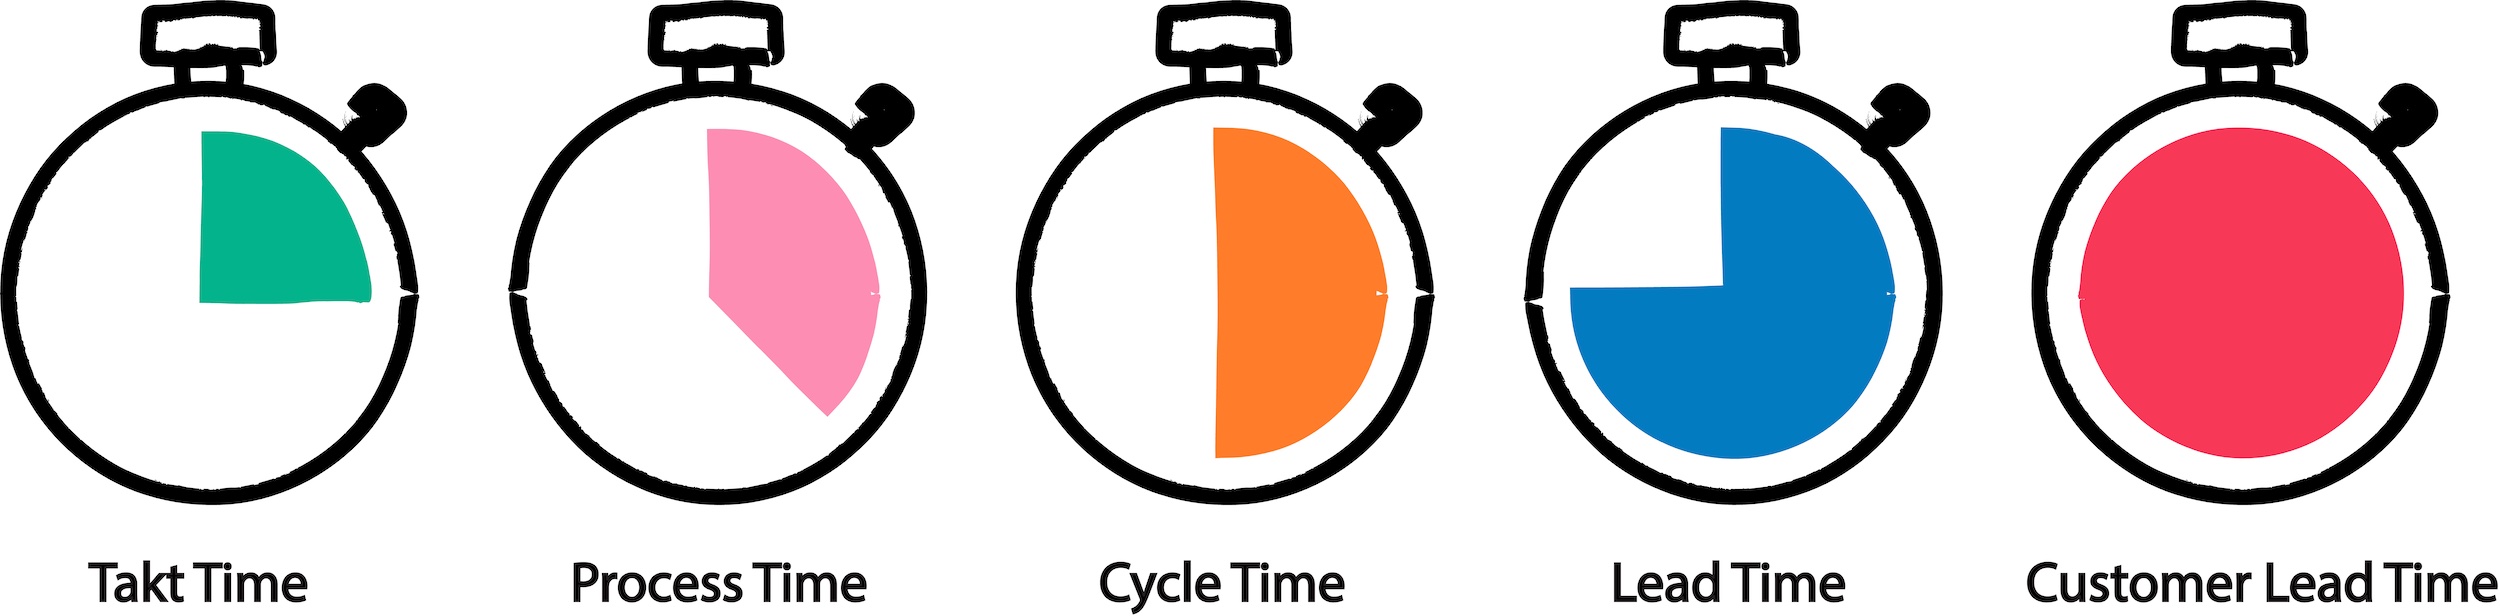
Process Time (PT)

This is often used interchangeably with Cycle Time. However, this is not completely accurate. Process Time is defined as “the time jobs are actually being worked on at the station” (Factory Physics 2011 pg 327)1. Now for a simple process (CT) and (PT) may be one and the same thing but it a process consists of many steps to produce one thing (Cycle Time) then what is the unit of time in each process step. That’s what we are calling Process Time and is illustrated in image 2.
We have even seen Cycle Time (CT) and Process Time (PT) interchanged by some practitioners as they don’t distinguish the intermediate steps in creating an item. Again, in manufacturing it’s often just decomposition of Cycle Time (CT), so they reuse Cycle Time, but all that does is confuse you.
You’re confused already aren’t you? Exactly!
Summary – (PT) is the time an individual step in a multi-step process takes.
Image 2 – Processing Time vs Cycle Time
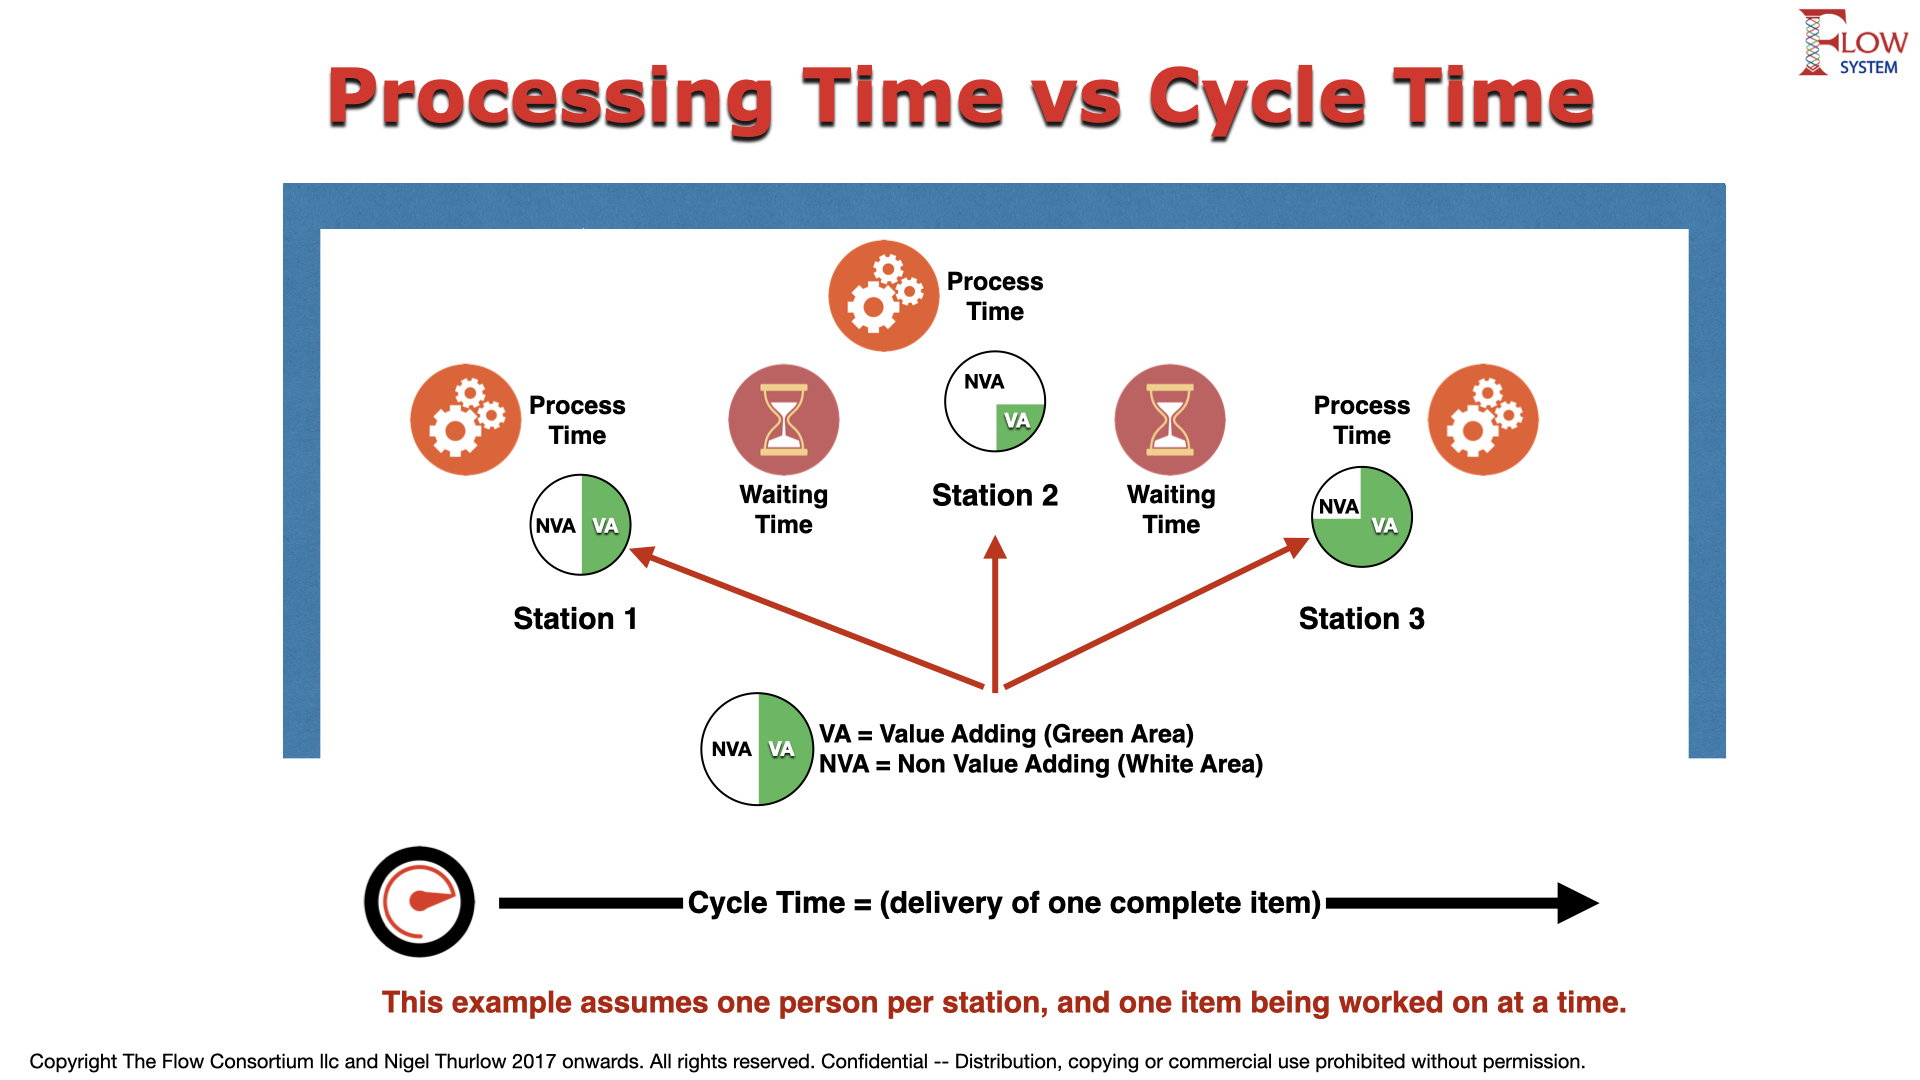
Value Creating Time
Also illustrated in image 2 is something I call Value Creating Time. This is the time actually spent creating value versus the other time consumed by the process. (PT) is the total time the job is being worked on at the station but that also includes non value added activity (NVA) and direct value adding activity (VA). Imagine you start to work on an item and then have to go looking for something. This is still being timed as Process Time, but it’s not adding value; it’s waste. This is how I am defining (VCT) vs overall (PT).
Summary – The portion of time when only (VA) is being created in a process. See (VA) definition earlier in this article.
Lead Time (LT)

Lead Time is a typically a business measure as it relates to things outside the pure product creation. It is a measure of delivery whereas Cycle Time is a measure of activity/work. The sum of all cycle times is the Lead Time (LT). Some books refer to this as Total Cycle Time, which again adds confusion.
Lead Time (LT) is the time to complete the order to the point shipping/delivery readiness. Lead Times contain Cycle Times, which contain Process Times, which contain Value Creating Times. Fun isn’t it!
Another confusion that emerges where some books and practitioners describe Lead Time in a sub-process.
- Imagine an assembly line that has many sub-assemblies that feed each other.
- Each sub-assembly may have several parts.
- Each part that is made is measured using (CT), the time to make one item.
Some practitioners will use Lead Time (LT) to describe the time taken to complete the sub-assembly ready for the next step to collect the finished item. They view the next step as their customer, hence using (LT). This gets worse when all sub-assemblies are delivered as a complete assembly and they use Lead Time (LT) again to describe that work product completion. It’s not wrong, it’s just confusing. It all depends on who the customer is from the supplier point of view. The key thing to note is Lead Time is a customer delivery metric and not a measure of work; that’s Cycle Time.
The better practice therefore is to use (CT). This is described in Factory Physics as “Manufacturing Lead Time” (page 331)1. Neither is wrong, but both depend on your context and understanding.
(LT) is typically used where there is an end customer involved, the recipient of the product in return for payment. Factory Physics describes this as “Customer Lead Time” (page 331)1, which we describe next.
Summary – Lead Time (LT) is the time to complete the order to the point ready for shipping or delivery. The total of all steps to create the customer order excluding delivery. Sometimes called Manufacturing Lead Time.
Image 3 – Initial Summary of Metrics
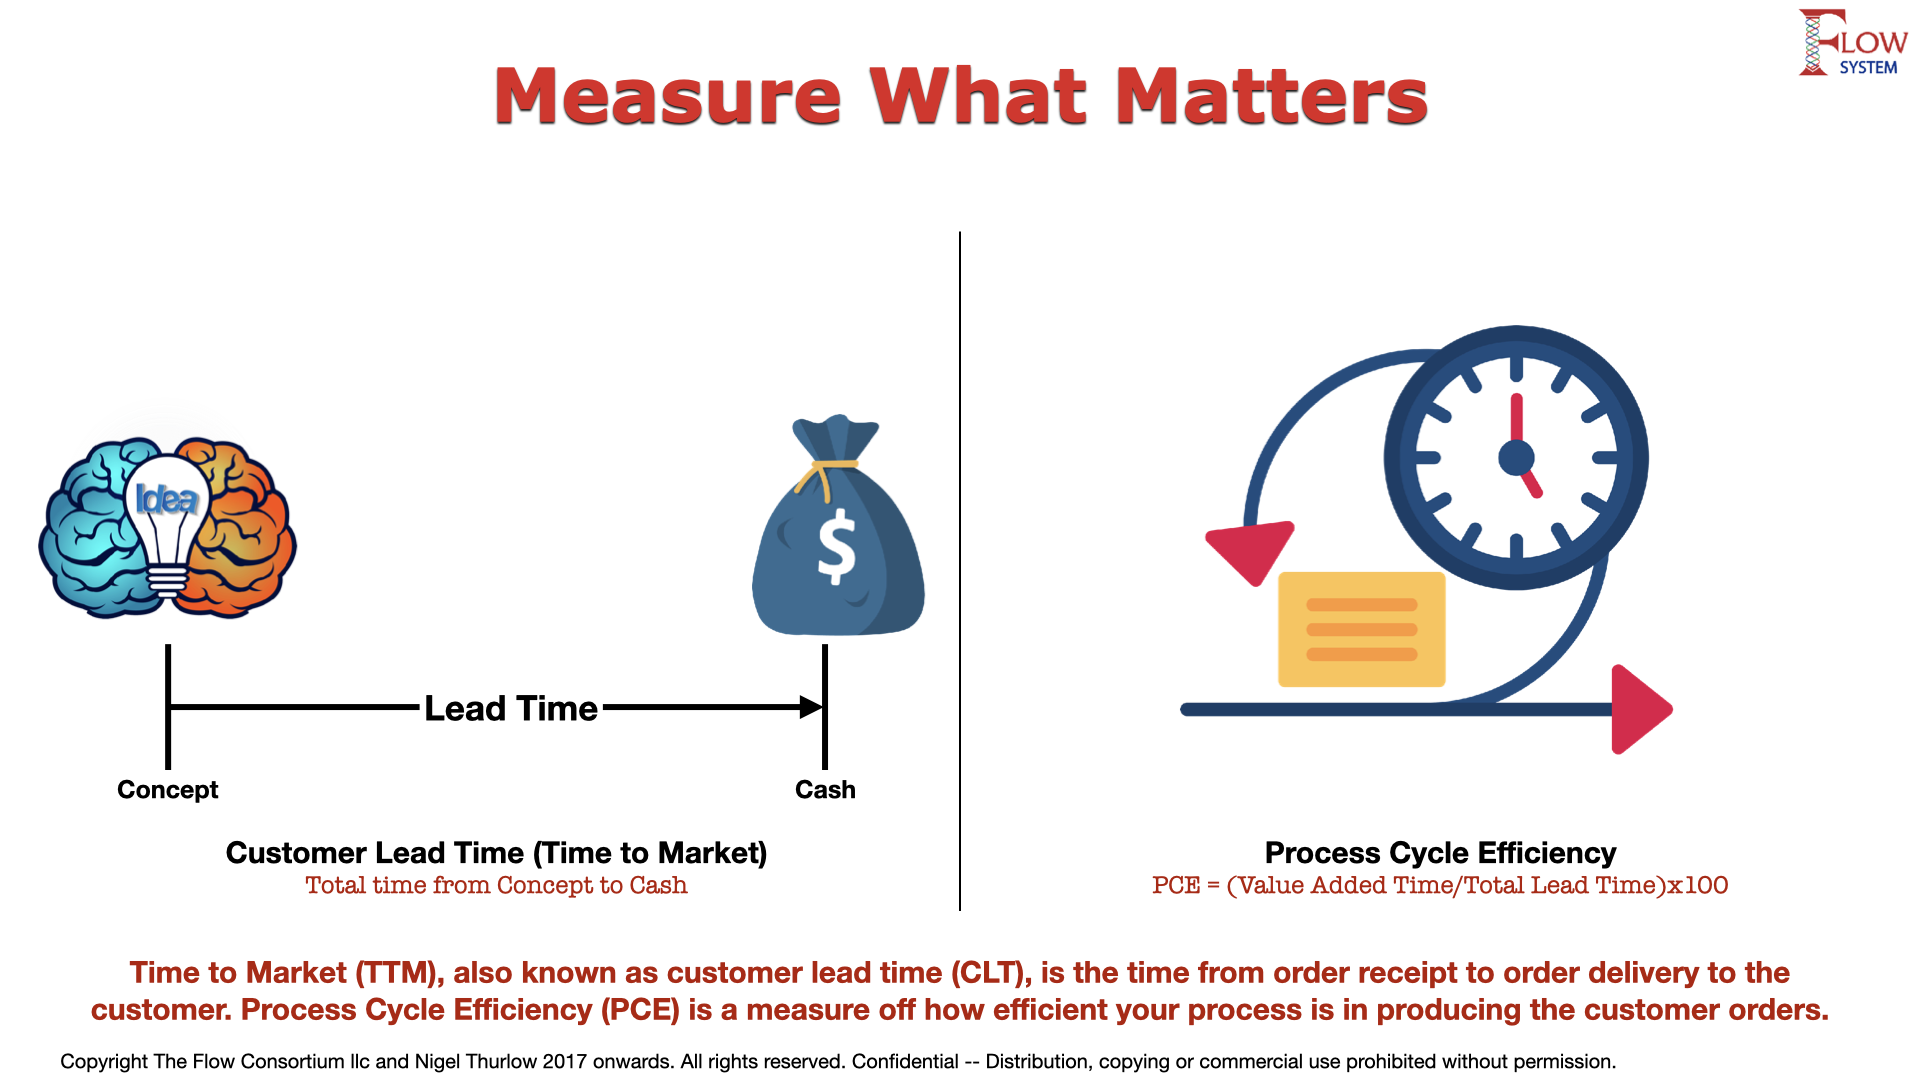
Customer Lead Time (CLT)

(CLT) is the time take to fulfil the order from request to acceptance by the customer. The time taken from when the customer gives you the request to the time they have the complete order in their hands.
It is critical to differentiate this from the time taken to make the products as there may be a measurable, and sometimes significant, delay between the two.
Your process of creating products may be extremely efficient with minimal (NVA) work, but the delay in the customer receiving and accepting the work can be significant, and this kills your overall Process Cycle Efficiency. Your shipping and delivery service needs to be as lean as your overall value creation process.
You may also have torturous governance and compliance processes between you completing the customer order and the customer actually receiving and being able to use what you sold them. In fact I am pretty sure you do if you are developing software.
Summary – (CLT) Is the total of (LT) plus the delivery time and until receipt by the customer is confirmed. This is the point at which you have ceased to control the lifecycle of the work.
Image 4 – The Key Lean Metrics
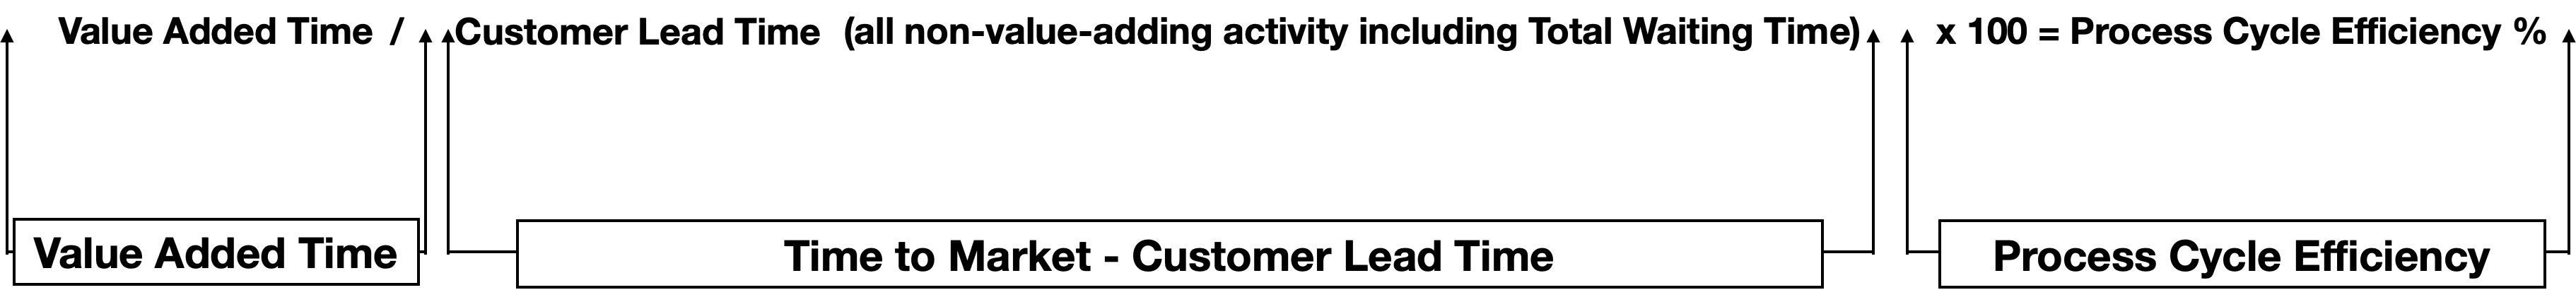
Process Cycle Efficiency (PCE)
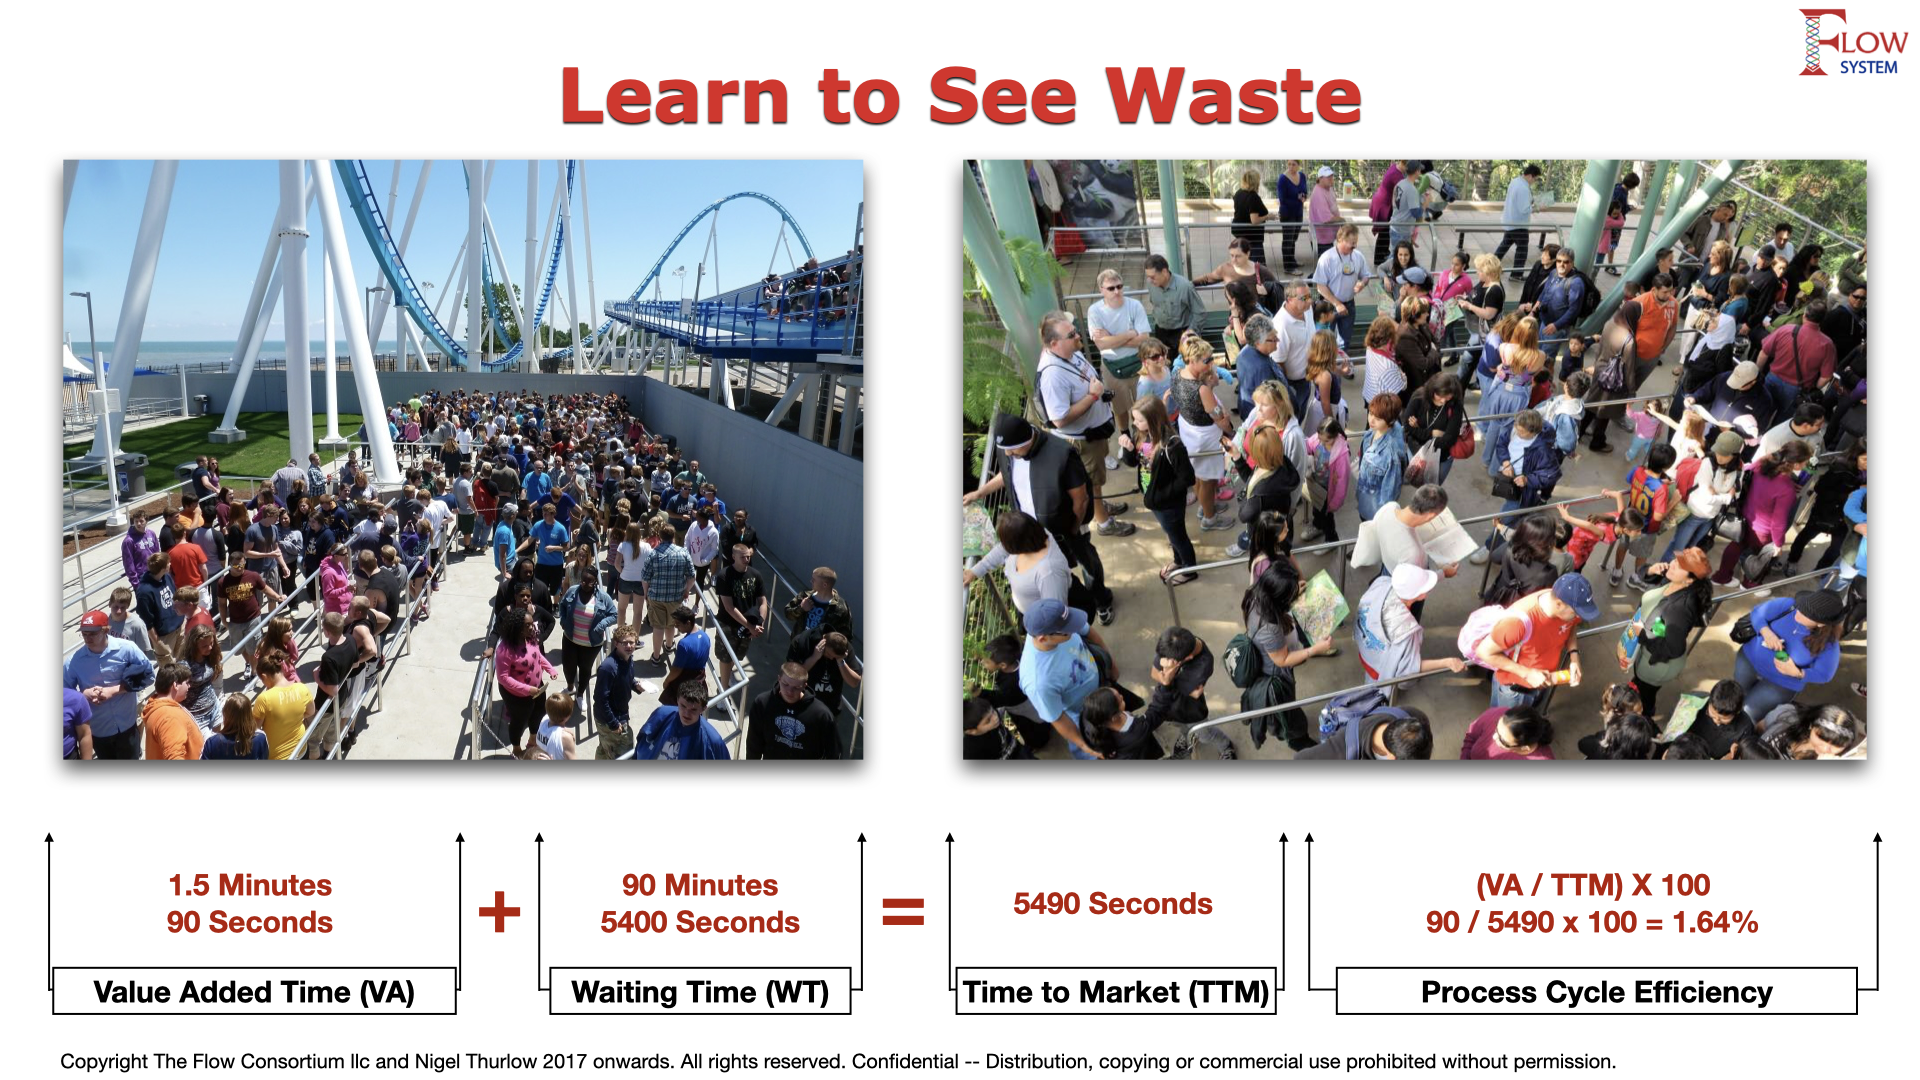
This is the efficiency of a process, or series of processes, calculated by dividing the total value-added time (VA) by the total customer lead time (CLT). Let’s imagine the scenario we see in a theme park illustrated in image 5 below.
- In this example we see that the people queuing for the ride spend 90 minutes in the line (this is waiting time (WT)).
- The ride last for 90 seconds (this is the Cycle Time (CT)).
- The Lead Time (LT) is simply the combination (WT) + (CT), in this case 91.5 minutes.
Image 5 – Example of Process Cycle Efficiency
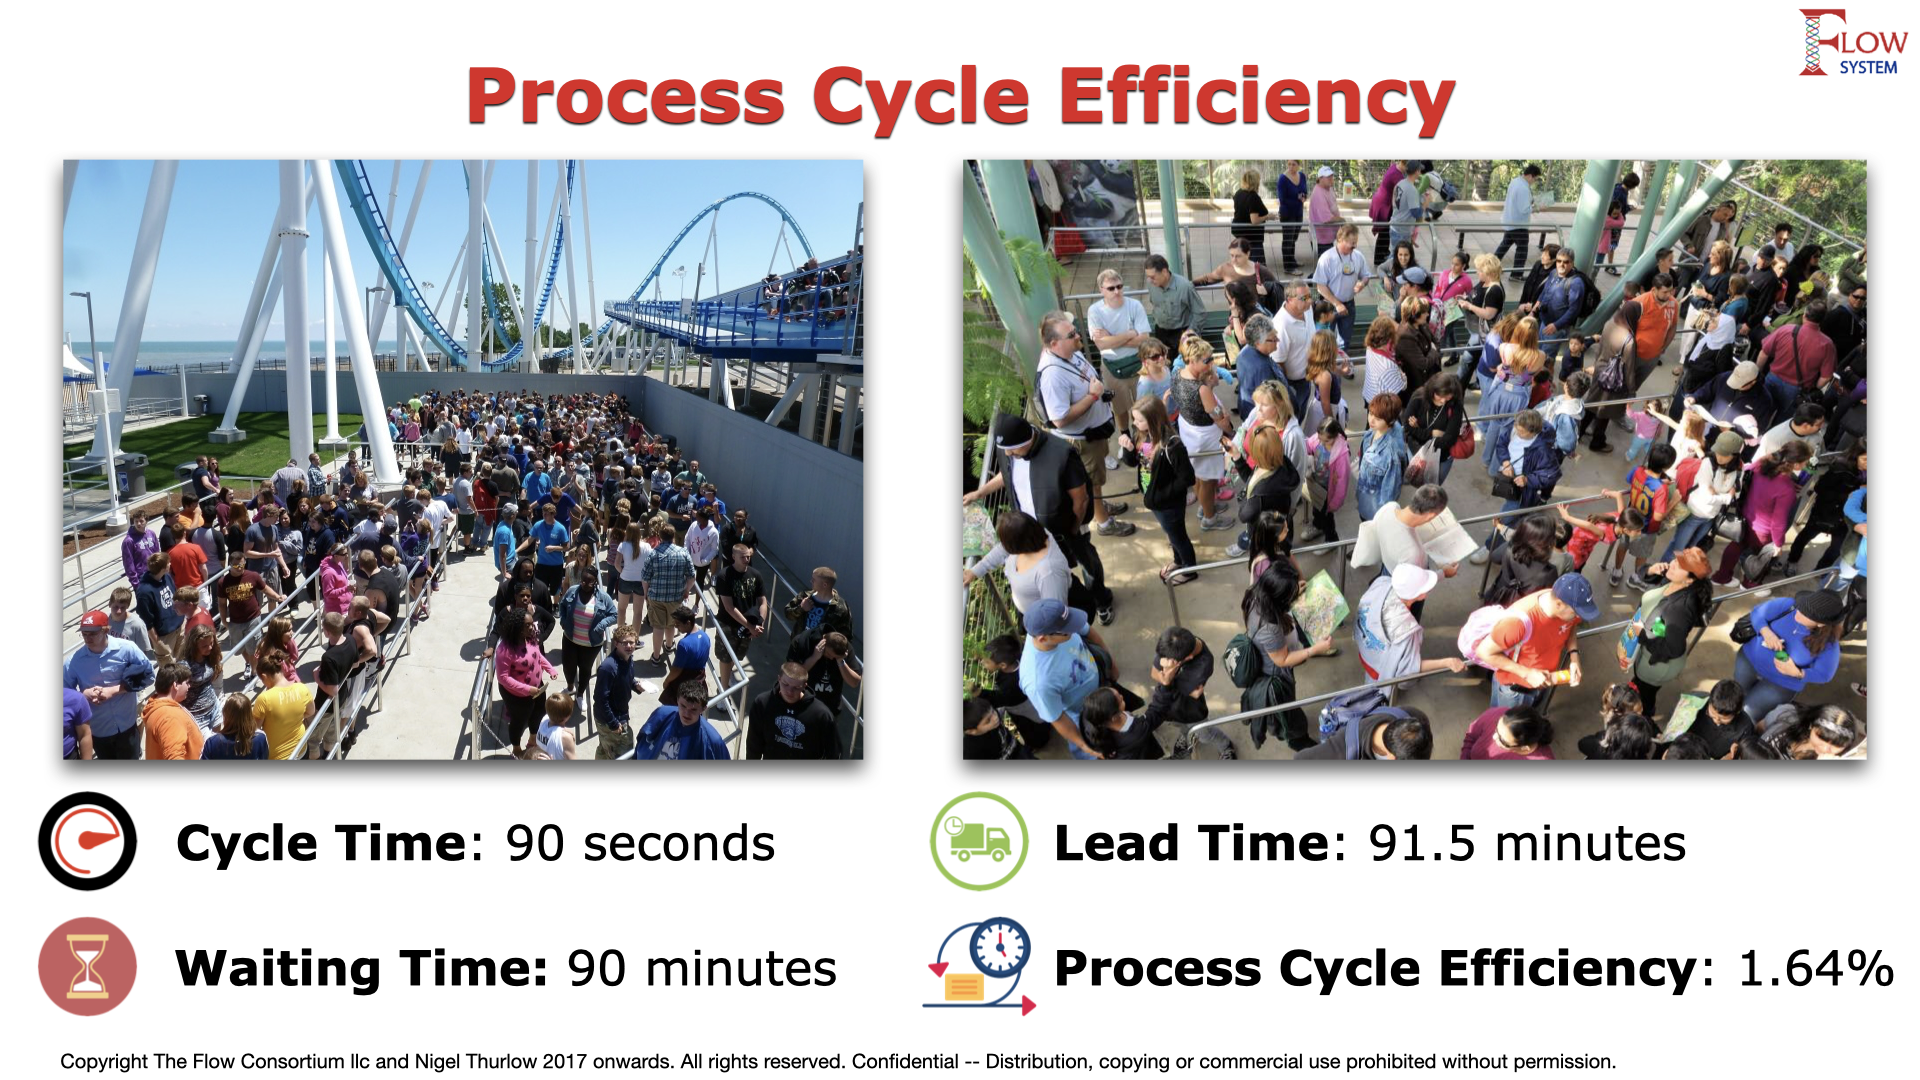
To calculate the efficiency, we simply divide the total value adding time, in this case the cycle time, by the total lead time from joining the line to getting off the ride having received the value. In this simple example the lead time is all waiting so we can simply classify that as (NVA). We are unable to examine the (CT) in detail so we assume it’s all value adding (VA) time.
The math looks like this
- Cycle Time/Lead Time X 100 = PCE% or
- (90 seconds / 5490 seconds = 0.0164) x 100 = 1.64%.
- Or read another way it’s 98.36% inefficient.
You just paid to wait to receive less than a 2% return on investment! Think about that next time you go to a theme park!
When using this metric in your own context it is important to fully understand the processes in depth to avoid your facts becoming statistics.
Summary – (PCE) is the end to end efficiency of a process represented as a percentage.
Image 6 – Using the Formula
Extending (PCE)
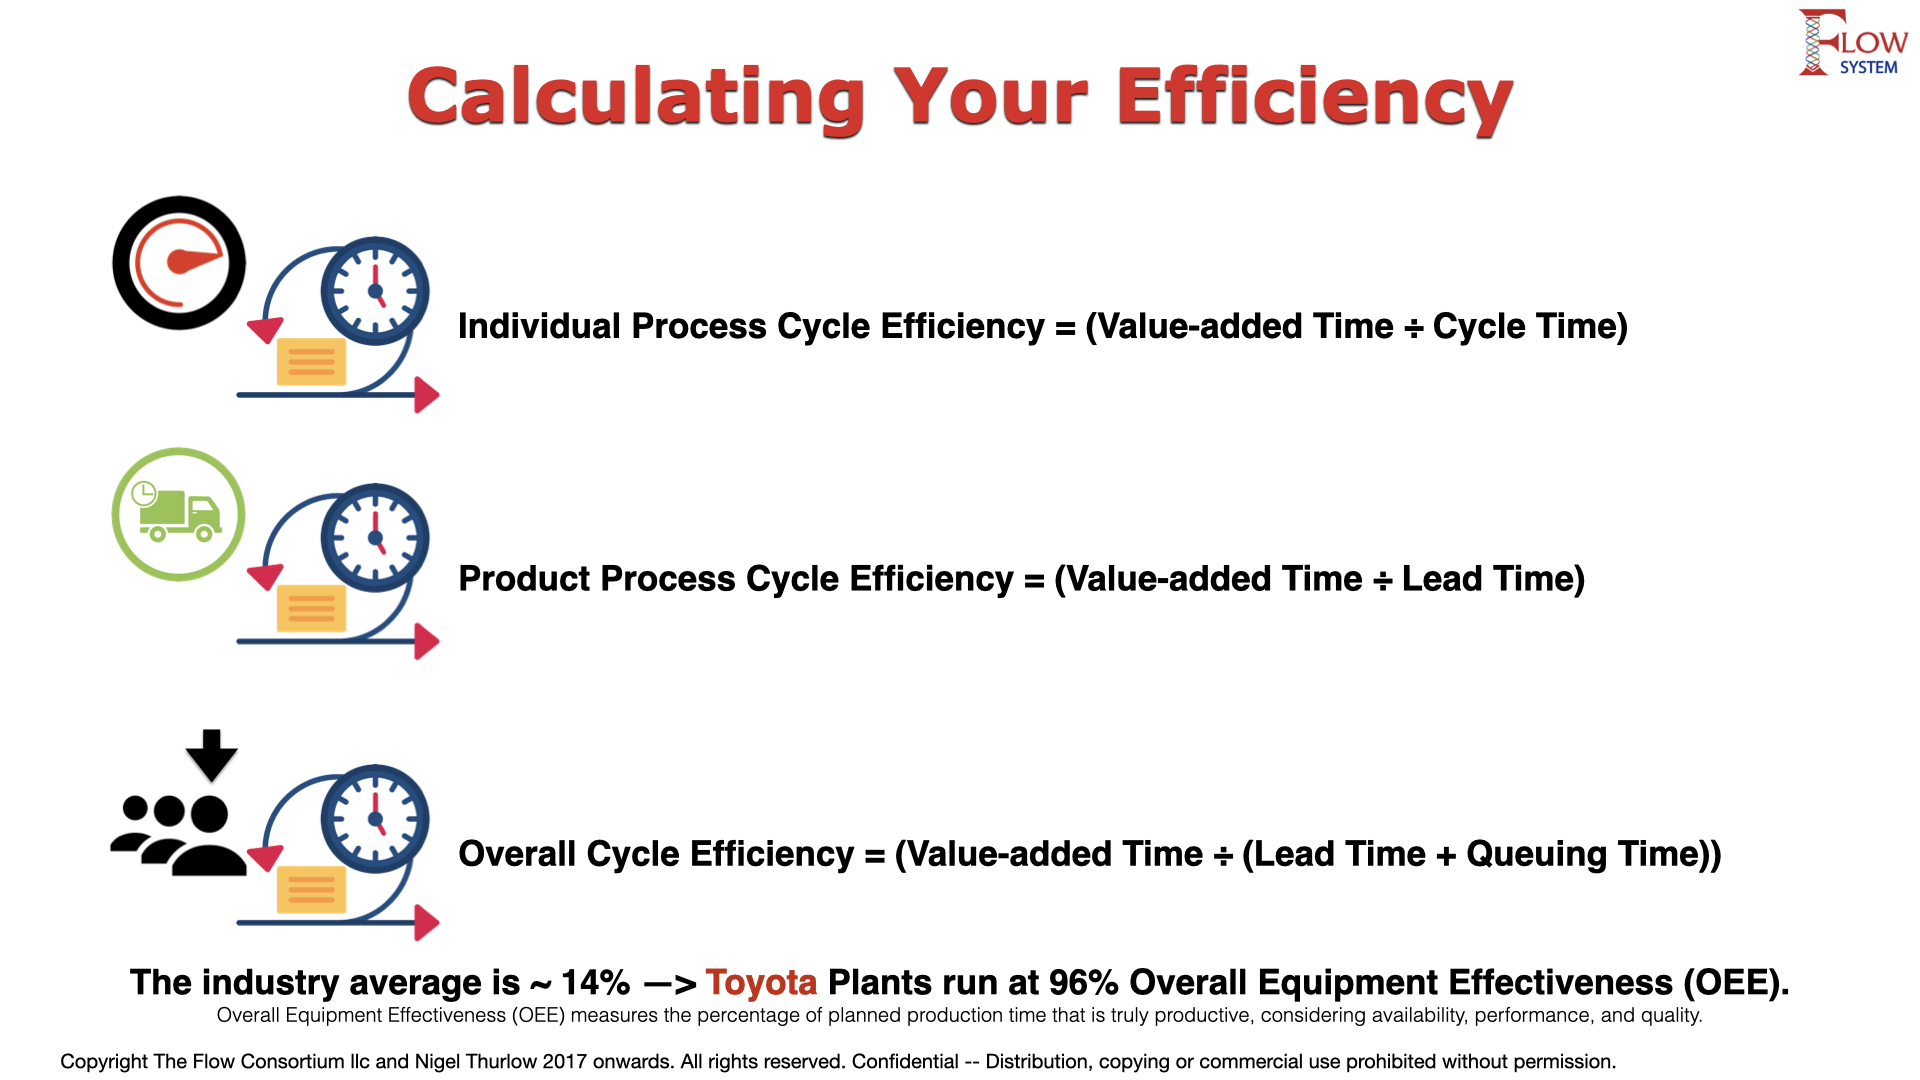
You can apply (PCE) to different levels of abstraction to determine the efficiencies across your product delivery. Some examples are shown in image 7 below.
Image 7 – Calculating Process Cycle Efficiencies
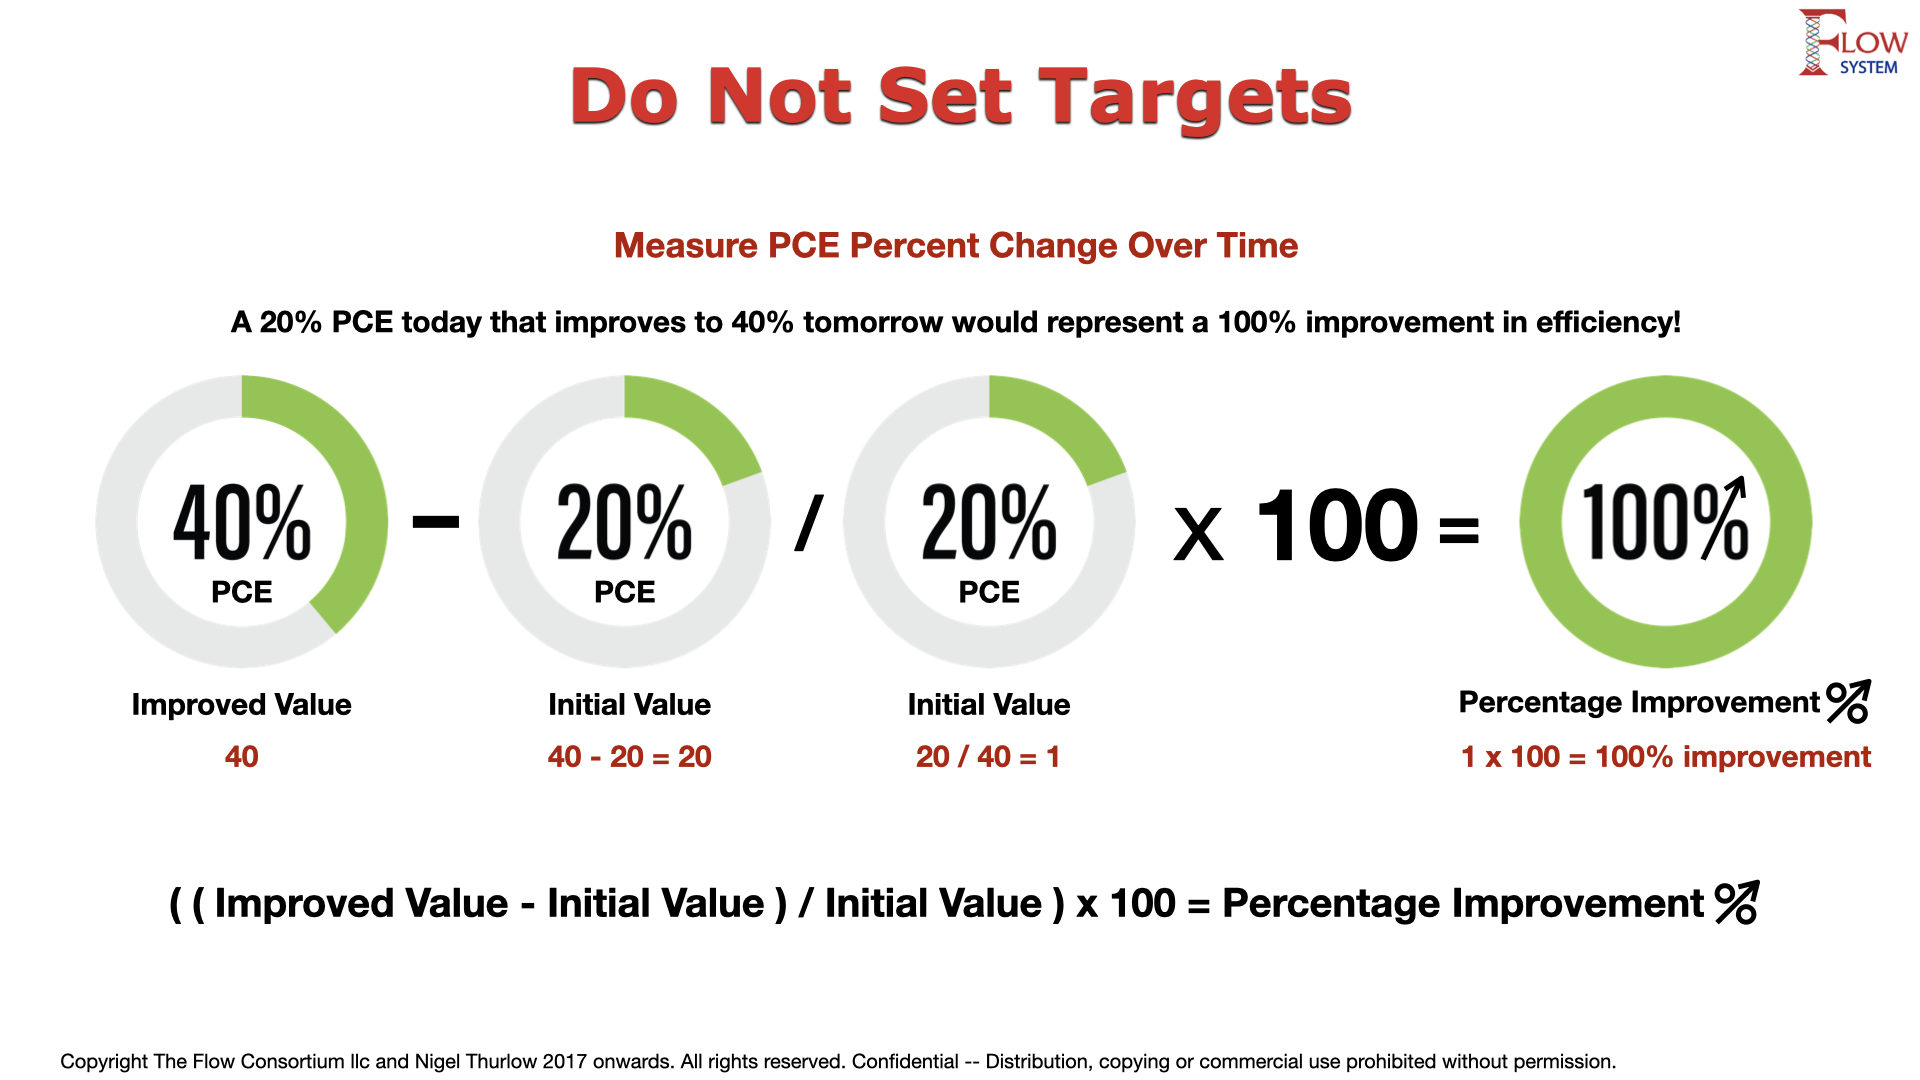
Measure the Improvement, Don’t Set Targets!
Process Cycle Efficiency (PCE) is the overall efficiency of the process. The Value Added (VA) work is divided by the overall Customer Lead Time (CLT) and multiplied by 100 to give a percentage. There is no industry benchmark or target. 20% might be amazing in your industry. In another 60% may be dreadful.
PCE Percent Change Over Time is what you measure. A 20% PCE today that improves to 40% tomorrow would represent a 100% improvement in efficiency! That would in most organizations be amazing!
To measure the improvement is simply percentage change over time. To calculate it take the Improved Value and deduct the Initial Value and divide the result by the Initial Value. Multiply the result by 100 to get a percentage change value.
The formula is ((Improved Value – Initial Value) / Initial Value) x 100 = Percentage Improvement
Image 8 – Measuring PCE Percent Change Over Time
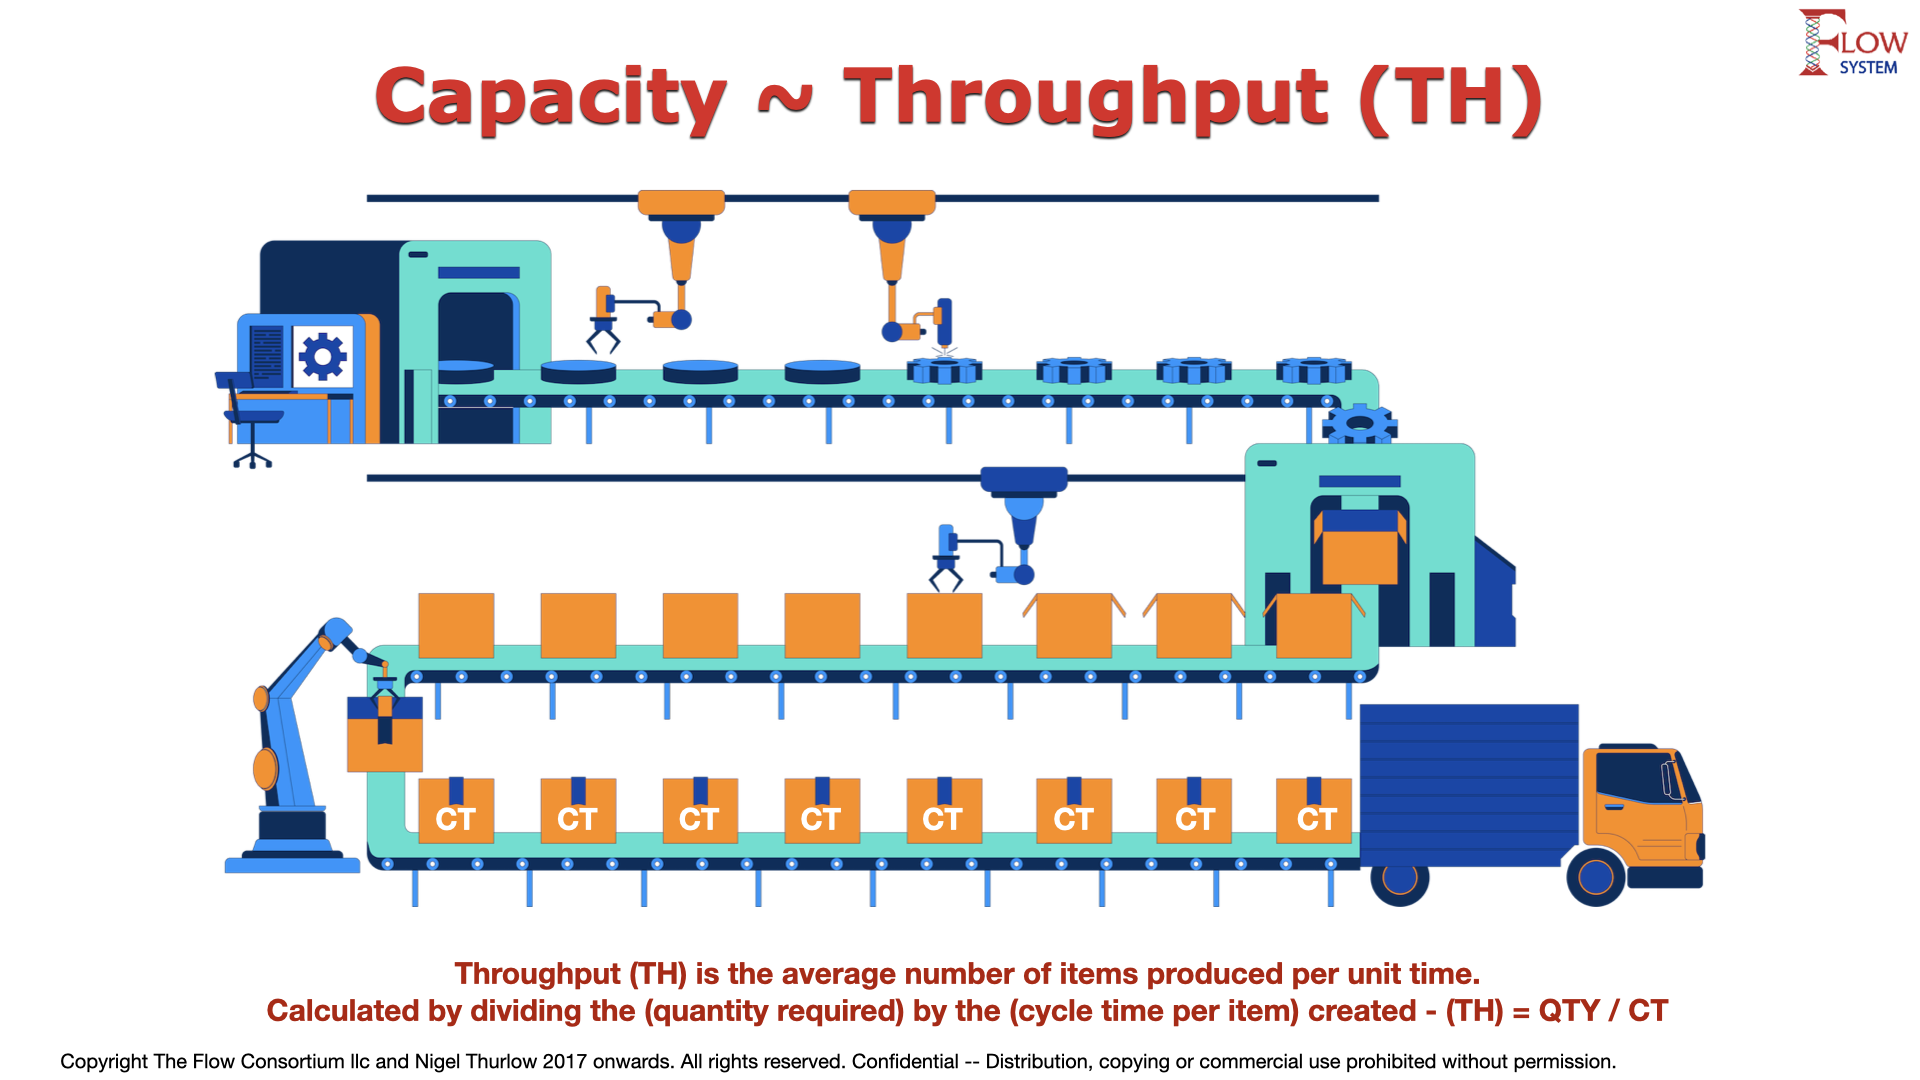
Throughput (TH)
I saved the best for last! Throughput (TH), also known as Throughput Rate. This is the average number of items produced per unit time. (TH) is a measure of volume or production, or the rate at which something is produced or delivered.
“At the firm [company] level, throughput is defined as the production time per unit time that is sold. However, managers of production lines generally control what is made rather than what is sold. Therefore, for a plant, line, or workstation, we define throughput to be the average quantity of good (nondefective) parts (the manager does not have control over quality) produced per unit time.”
“When throughput is measured in cost dollars (rather than in prices) it is typically called cost of goods sold.” (Factory Physics 2011 pg 229)1
Throughput is, therefore, simply the rate at which something can be processed and is calculated by dividing the output by the duration. (TH) = QTY / (CT)
There are practitioners that use Lead Time (LT) and Throughput (TH) interchangeably. This is wrong.
Image 9 – Relationship between Capacity and Throughput
Example: if you want 40 items in 40 hours and the average throughput is derived from the QTY/CT then you can forecast the (LT). If the time to make one thing is 1 hour, and the customer wants 40 things, then you can forecast the Lead Time (LT) as 40 hours. After the work is done the (LT) is of course equivalent to (TH) in this scenario. BUT…
The problem with this is (LT) is not a forecasting metric, it is a lagging metric, or a measure of what happened, not of what might happen. (LT) is a measure of TIME whereas (TH) is a measure of volume or rate of flow.
(TH) is, however, a leading metric as it can forecast what could be expected.
An Agile Example Using (TH)
In Agile contexts you can calculate the average throughput rate of your team like this. Imagine the team deliver the following completed user stories or product backlog items (PBIs).
- Monday, they deliver 5 items.
- Tuesday, they deliver 3 items.
- Wednesday, they deliver 4 items.
- Thursday, they deliver 3 items.
- Friday, they deliver 5 items.
- The total items produced is 20 items.
- They worked 5 days.
- Their (TH) is therefore 4 items per day.
Their throughput is calculated like this: (5+3+4+3+5 = 20) / 5 days = 4 items per day.
Throughput measures rate of output and therefore quantifies how fast you develop products. This could be a replacement for Velocity and is what the #NoEstimates movement is advocating. No Estimates breaks down work into very similar sized units. This means they can calculate items (PBIs/User Stories) in a defined time (Sprint/Iteration). Now, I am simplifying for this article. If you want to know more I encourage your individual research.
Throughput is also related to Process Cycle Efficiency (PCE). If you improve the efficiency of your process you will improve (TH). If you are delivering later than desired you need to focus on your Process Cycle Efficiency (PCE).
Image 10 – Relationship between Throughput and Process Cycle Efficiency
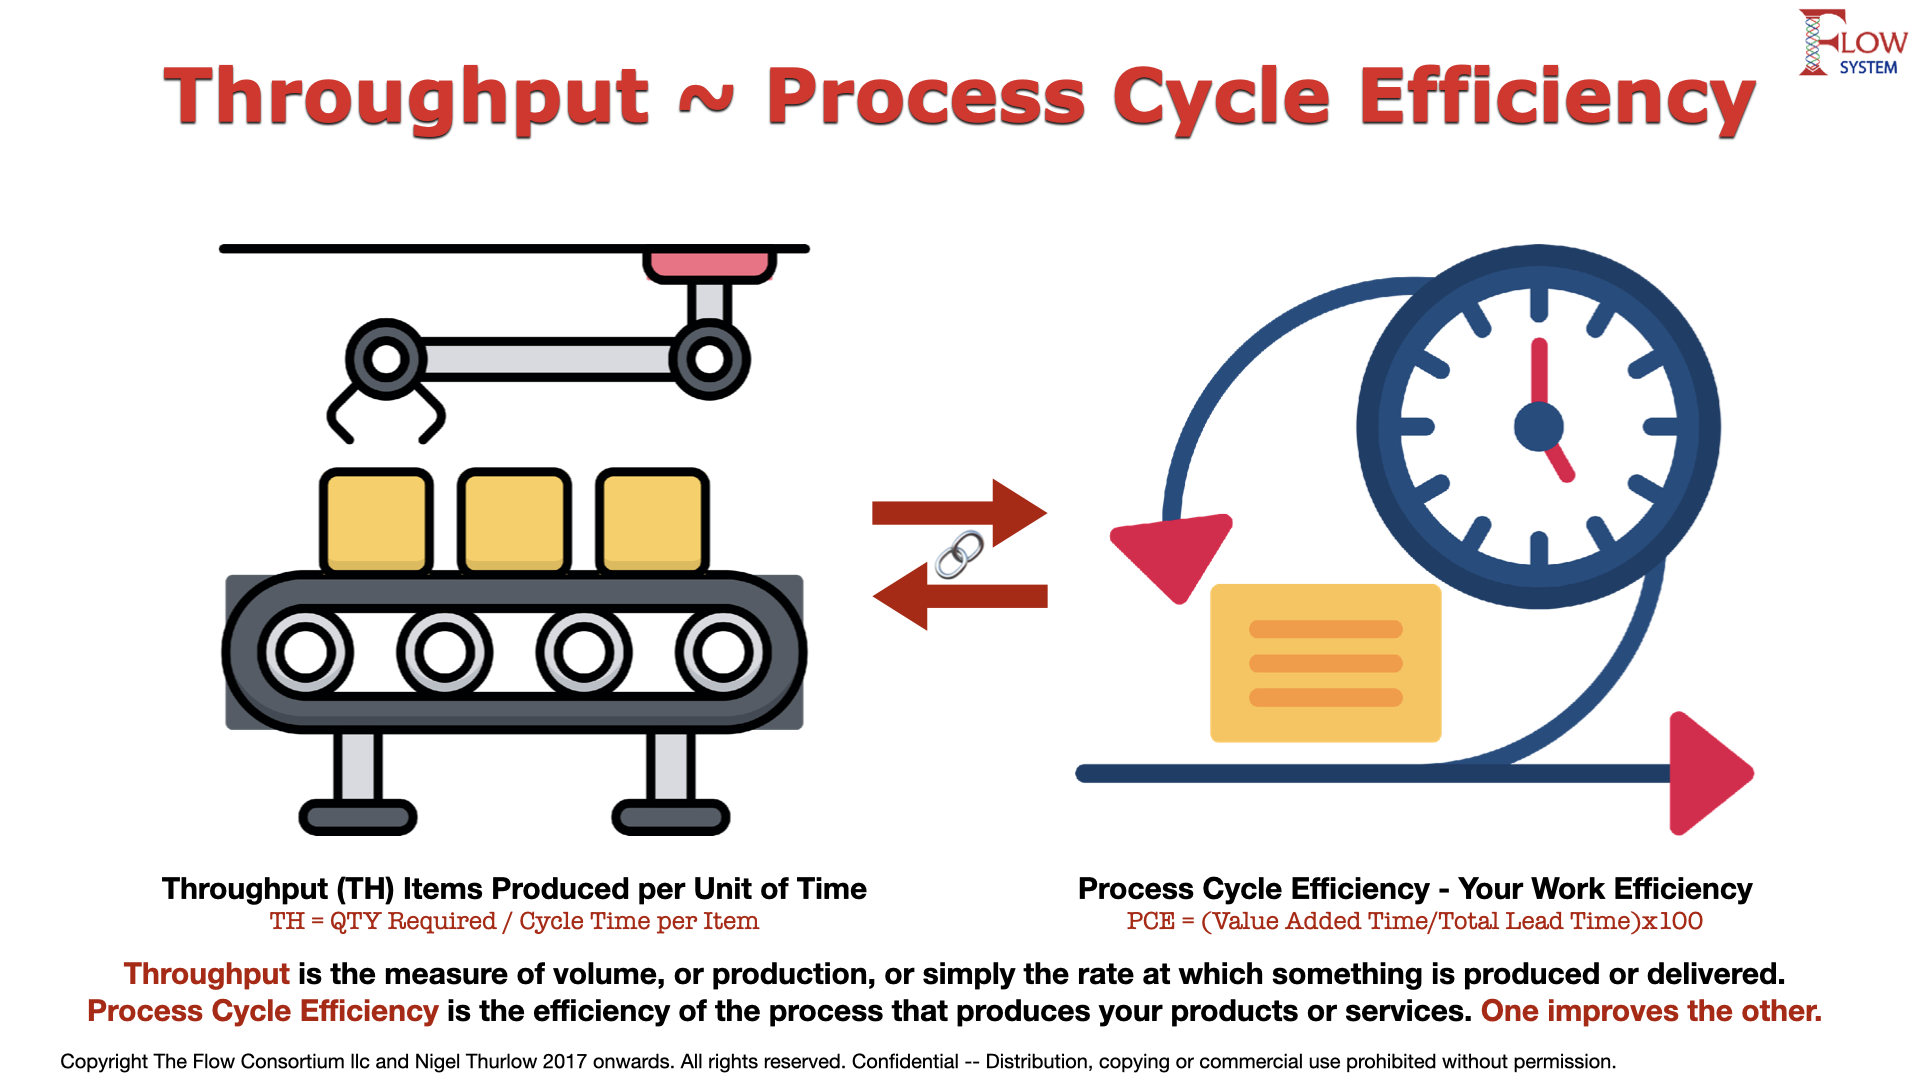
Summary – Throughput is the rate at which something can be processed and is calculated by dividing the output by the duration. (TH) = QTY / (CT)
Image 11 – Key Metrics to Track
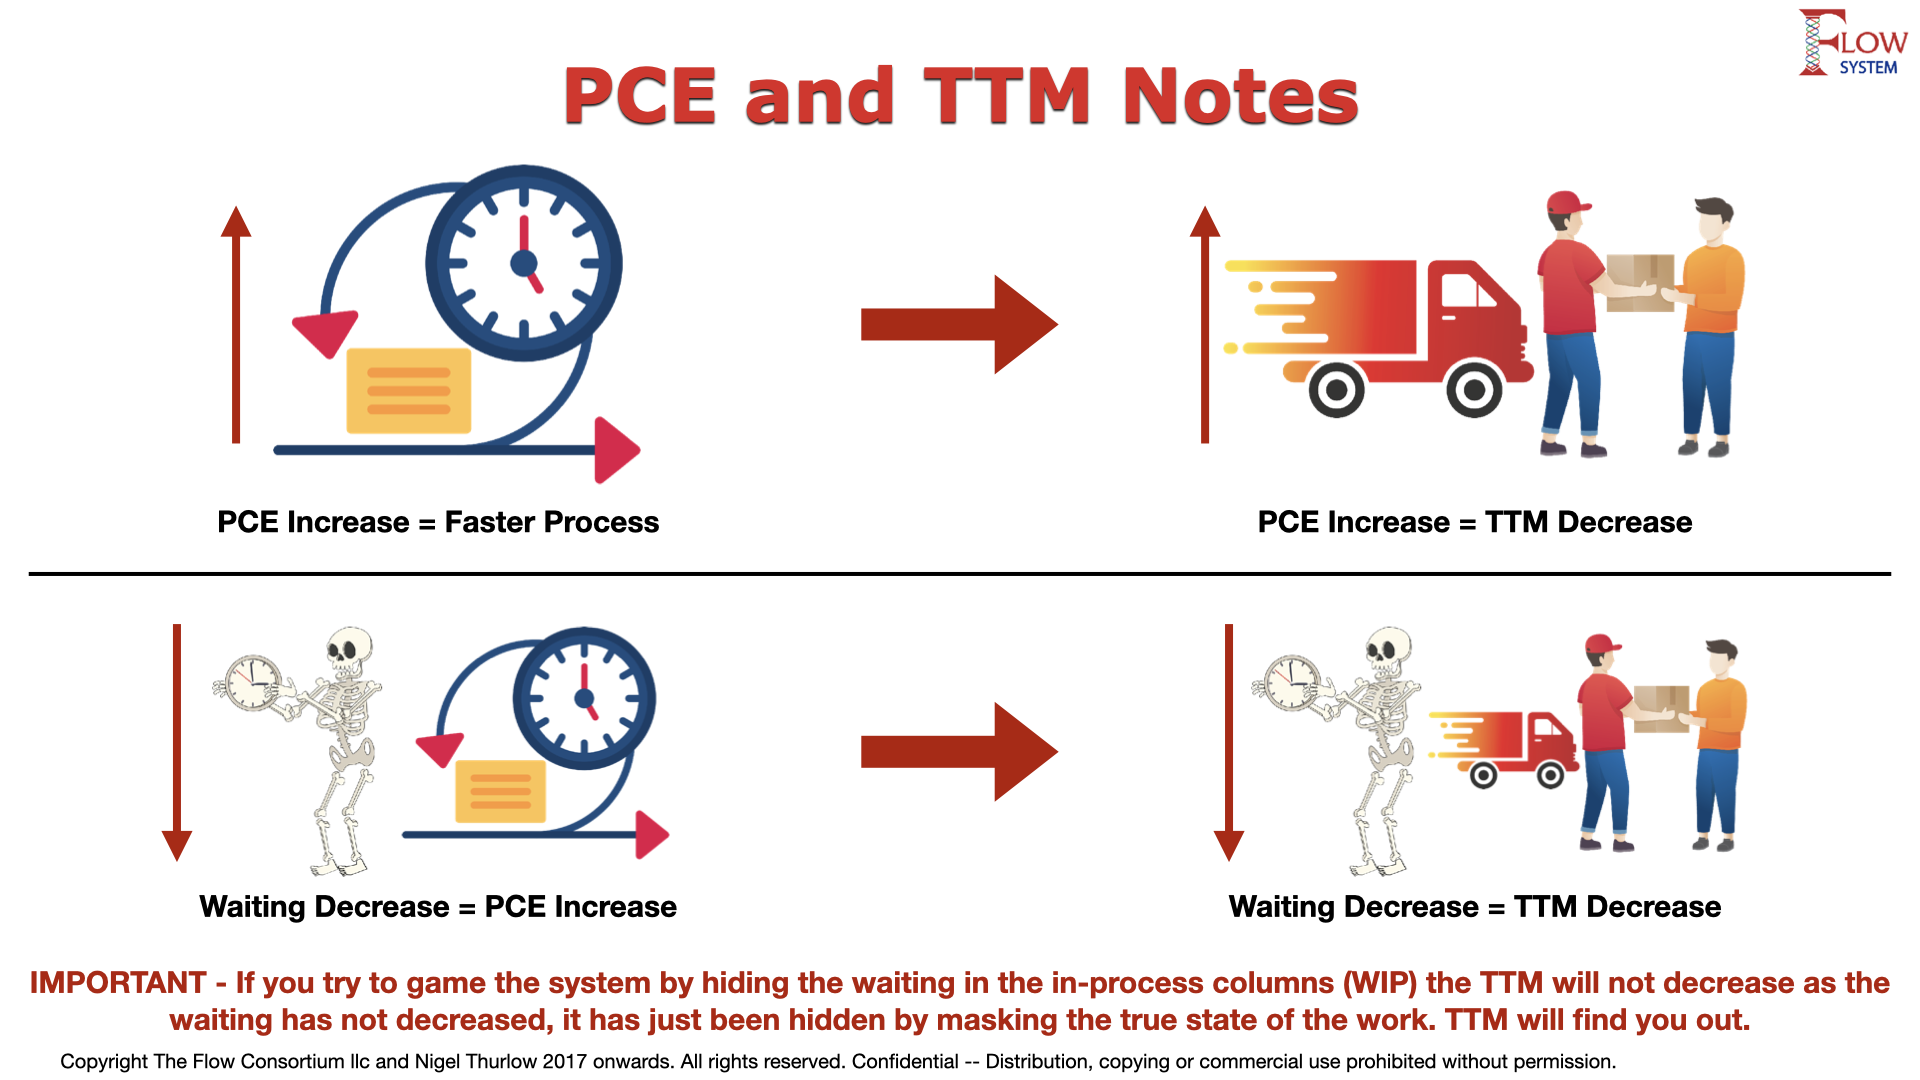
In my view, the two most important elements to measure are, Lead Time (LT), also known as Time to Market (TTM), along with Process Cycle Efficiency (PCE). If you improve the efficiency of your system, its flow, your Lead Times will come down and your cost to make will be lower. Your return on investment (ROI) and your profitability will increase as a result.
PCE is sometimes incorrectly called “Flow Efficiency”. The latter is a measure that emerged in the software “Kanban Methods” courses and is adapted from work by Mik Kersten in the book “Project to Product”. The issue with this measure is it only accounts for “waiting” in the process, and not all other forms of non value adding waste. It is therefore flawed in my opinion. You must measure all aspects of a system to be able to improve that system. Starting with the waiting is easiest and gives a quick “bang for your buck”, but if that’s all you do, you are leaving money on the table.
Hiding the Waste
There is a risk that people will try to game the system by hiding the waste of waiting in the work in progress columns. In a typical Agile Lifecycle Manager (ALM) like everyone’s favorite “Jira” there are columns for work that is waiting (To Do), and work that is active (Doing). By moving the work into the doing column you mask the waiting as it is now not being measured. This is where “Flow Efficiency” fails. The work is now in progress as it is in the “Doing” column so no waste is present, or so it seems.
The way you spot this is illustrated below, but in simple terms if your PCE is improving but your Lead Time or Time to Market is not, people are gaming the system.
Image 12 – Gaming the System
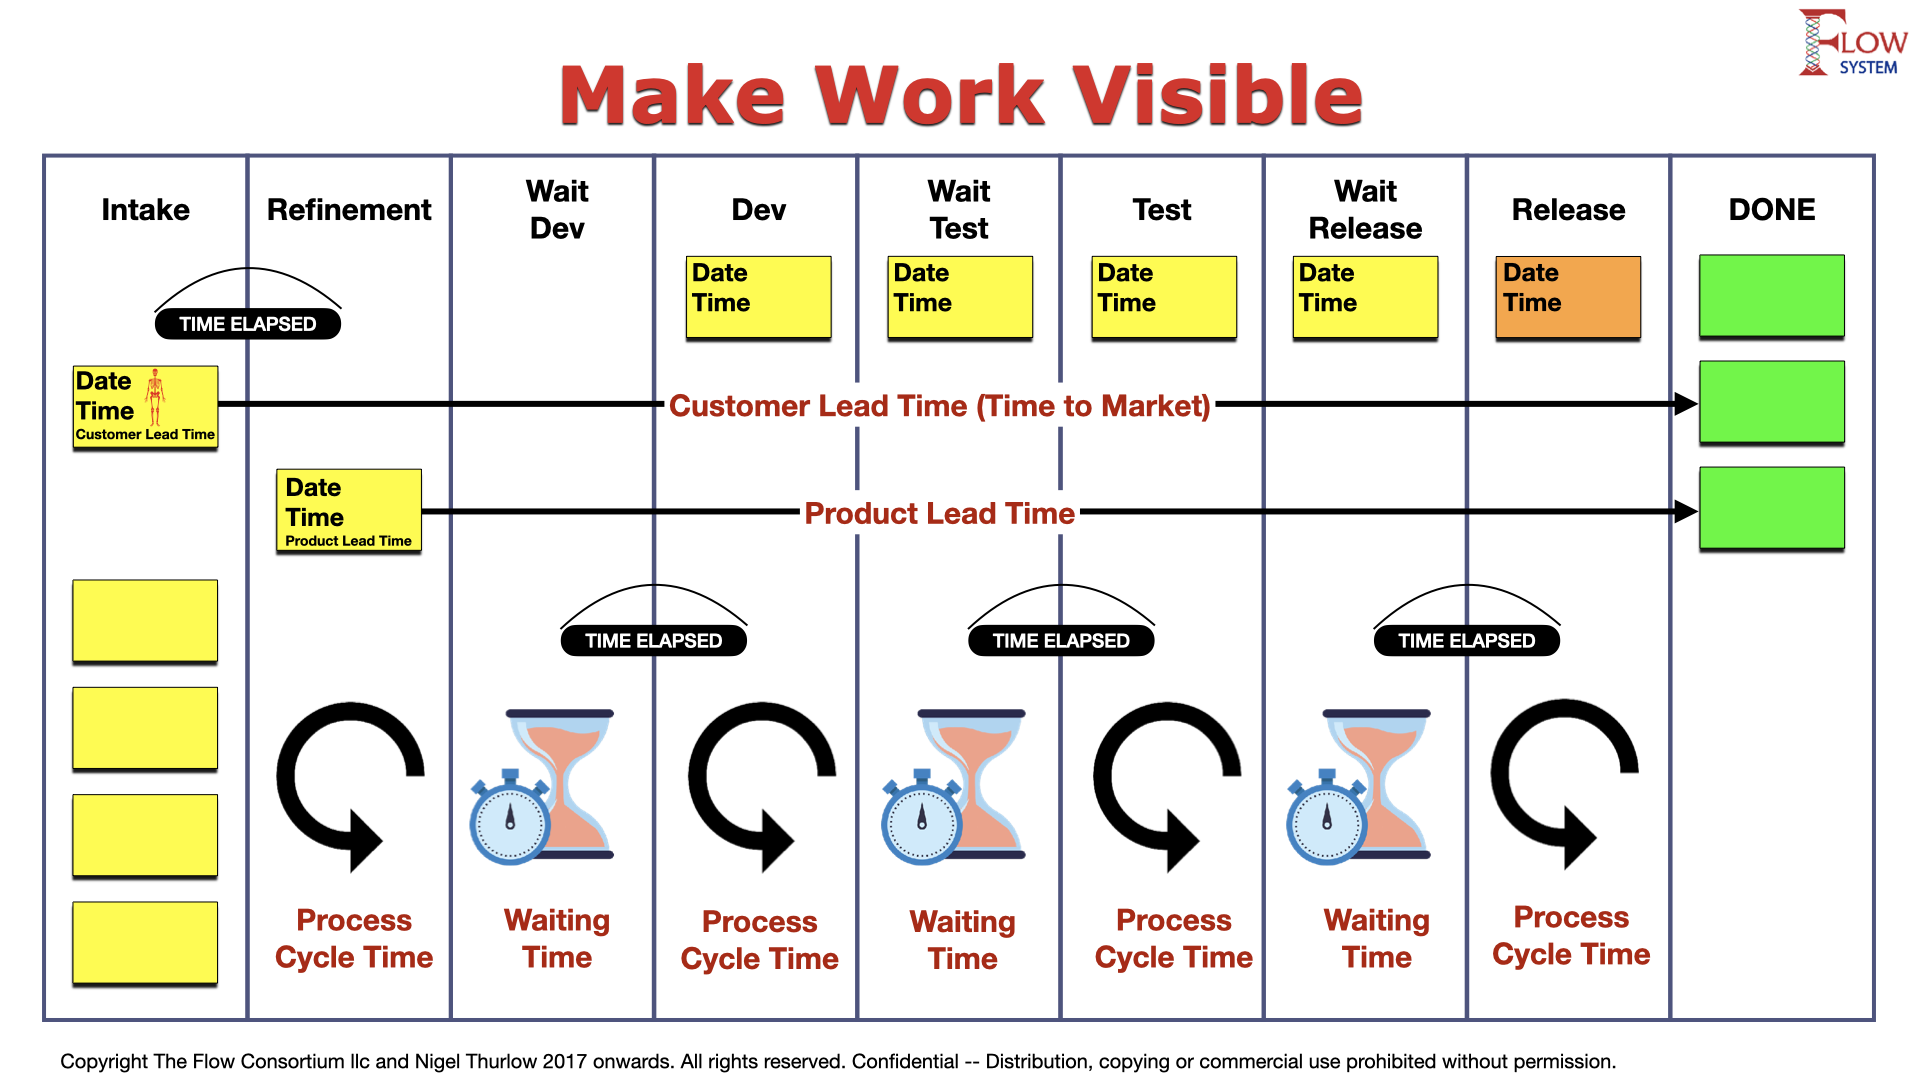
Make Work Visible
My advice to you is to make sure every step in the process of doing work as a waiting column. So as a ticket, card, or kanban proceeds through the system to be worked on, you ensure that each step or process transition should also have a corresponding waiting column. Unless the item is actively being worked on versus simply be assigned to the next step, it should be in a wait state and measured as such. An example of a visual work board is seen below. You need to measure how much time is spent waiting for each process step as well as how long the work spends in each process. Then you can start to find the constraints in your system.
Image 13 – Making Work Visible
Summary – If your process is being reported as improving but you Lead Time or Time to Market is not improving, someone is masking waiting.
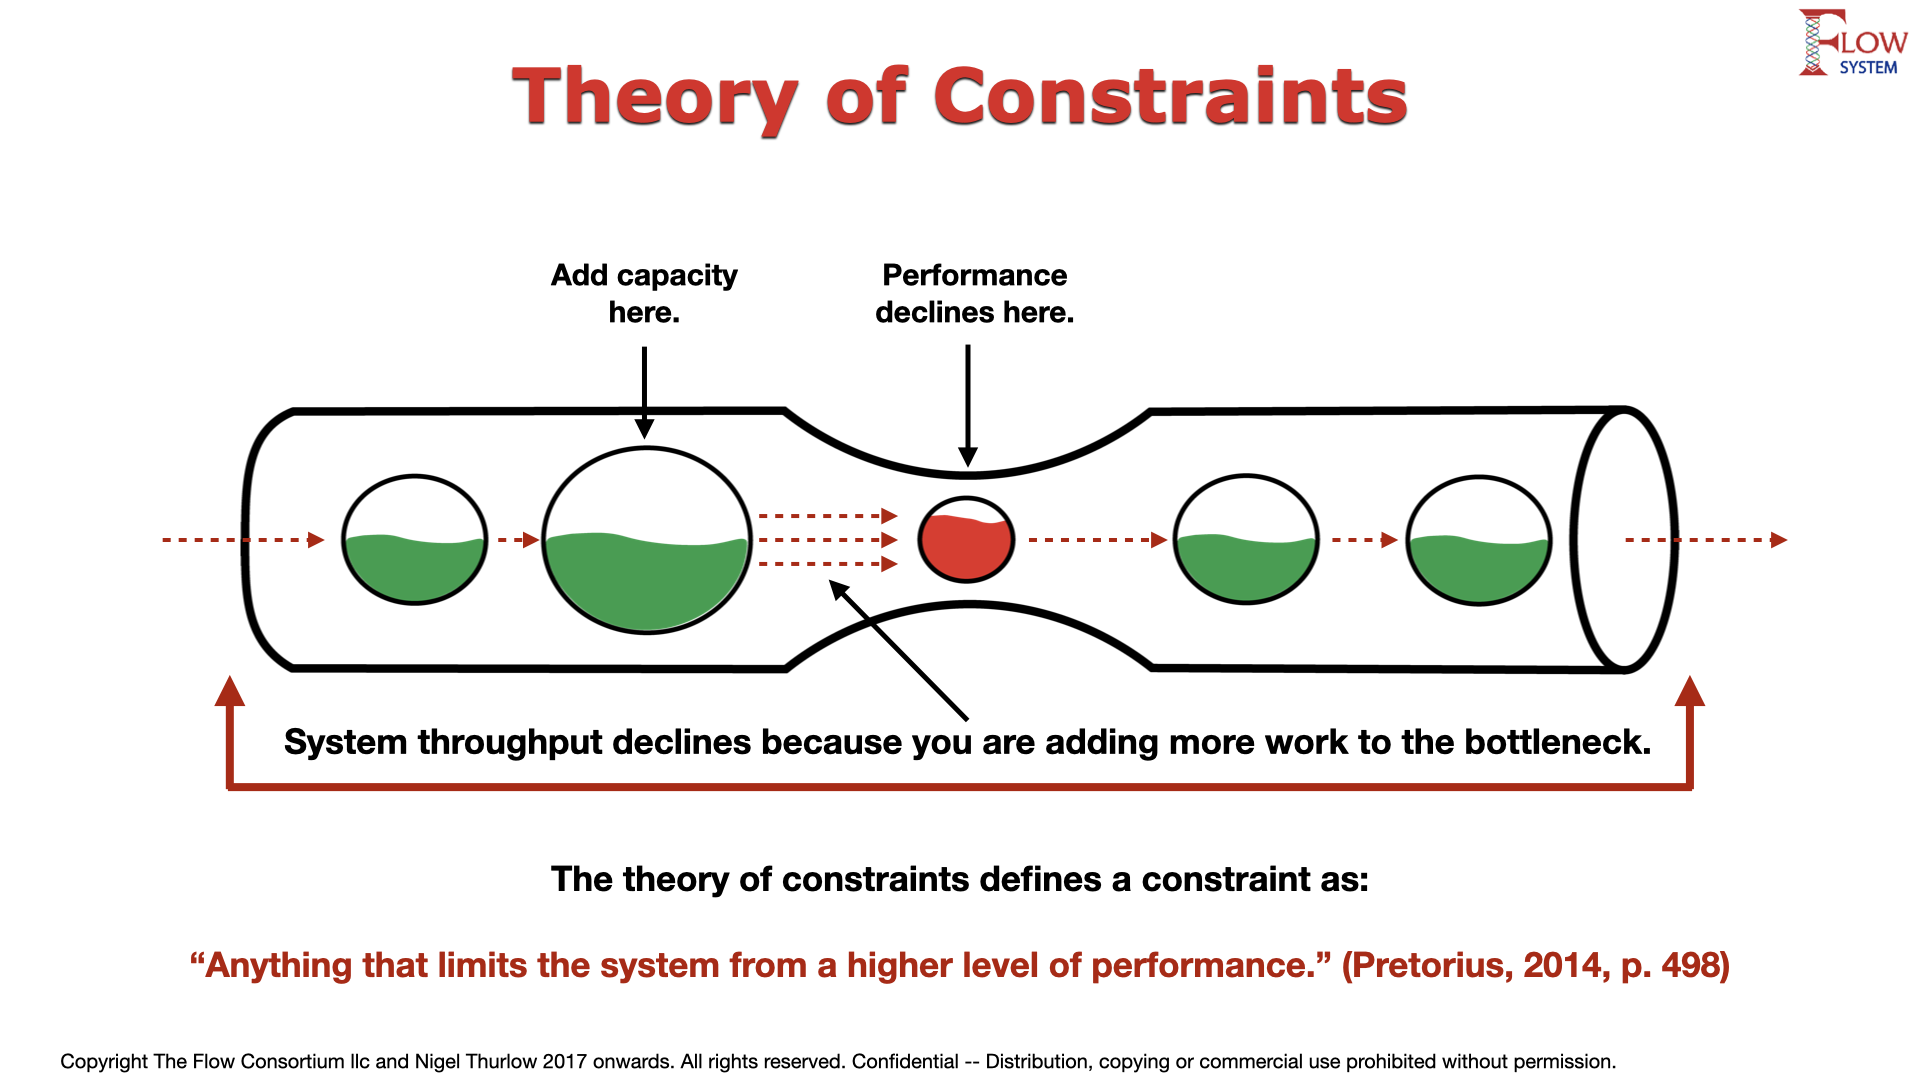
The Theory of Constraints and (TH)
There is a whole extra dimension to Throughput from the practitioners of The Theory of Constraints (ToC). ToC only looks at revenue and defines (TH) as the rate at which the entire organization generates money through sales for a product or service, or words to that effect. Or stated as “Throughput is the rate at which the system generates money through sales”. In the book The Goal by the creator of ToC, Eli Goldratt, the character ‘Alex’ learns that his goal is to make a profit, to make more and more money. The eventual goal of a start-up is to make a profit.
“So this is the goal: To make money by increasing net profit, while simultaneously increasing return on investment, and simultaneously increasing cash flow.” Eliyahu M. Goldratt, The Goal: A Process of Ongoing Improvement
This is of course contrary to the Lean view. i.e. Customer 1st.
Drucker also stated “the purpose of a firm(company) is to create a customer”.
Toyota has always stated “Customer 1st” since 1946.
So, you pays your money (pun intended) and you takes your choice.
From a business view, (TH) it is the amount of a product or service that a company can produce and deliver to a client within a specified period of time. This sort of supports the Factory Physics definition.
Image 14 – The Theory of Constraints
Endnote
I have tried to give you a helping hand in understanding the right way to use these metrics. I am sure others will have their own version, but that’s the point of writing this. In the words of my friend and mentor Ritsuo Shingo “I don’t care!”. I also worked at the place that defined most of these metrics, Toyota. I am giving you the knowledge I was given. This is how we did it at Toyota for the most part.
Key References
1 Hoop and Spearman – Factory Physics Third Edition 2011 ISBN: 978-1-57766-739-1
2 Taiichi Ohno with Setsuo Mito – Just-in-Time for Today and Tomorrow 1986 ISBN: 0-915299-20-8
3 Taiichi Ohno – Toyota Production System Beyond Large Scale Production 1988 ISBN: 0-915299-14-3