Seeing the System: From Toyota’s Material and Information Flow to an AI-Powered View of Your Organization
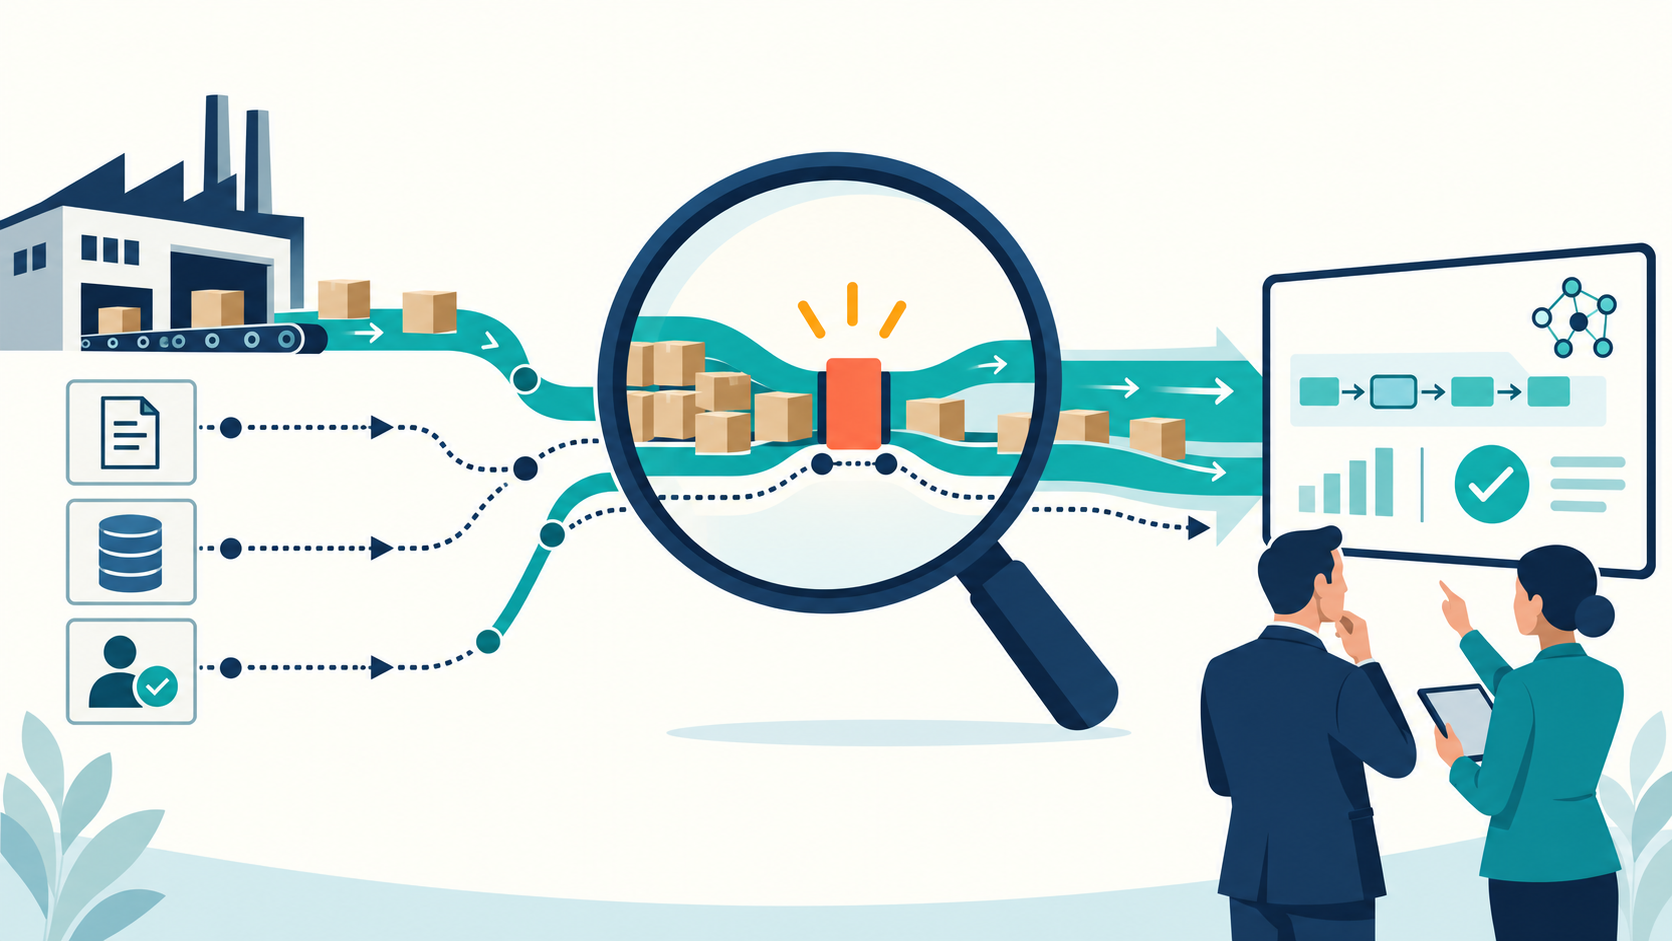
AI value stream mapping offers an opportunity to connect the evidence scattered across an organization’s systems. But understanding how work actually flows requires more than connecting applications. It requires understanding the relationship between materials, information, decisions, and the people doing the work.
Organizations spend considerable amounts of money capturing information about their work. They record customer requests, production orders, project activities, approvals, purchases, defects, deliveries, and financial transactions. They invest in enterprise systems, reporting platforms, and dashboards to make that information accessible.
Yet ask a straightforward question such as, “Why does it take so long for work to move through this organization?”, and the answer often requires weeks of interviews, workshops, spreadsheets, and debate, often by those paid to create PowerPoint decks!
Sales has one explanation. Operations has another. Finance is concerned about cost. Technology points to dependencies. Individual teams can demonstrate how busy they are, while customers continue to wait.
Much of the evidence needed to understand what is happening already exists. It is distributed across systems that each describe a fragment of the work. The difficulty lies in connecting those fragments into a coherent explanation of how the organization actually operates.
That is the opportunity I have been working on with specialist partners: combining years of experience in the Toyota Production System, Lean, Flow, and organizational improvement with the ability of AI to interrogate evidence across business systems.
The result is a capability with the working title Digital Brain™. It brings together the records of work, reveals the conditions affecting its movement, and helps leaders understand where intervention is needed, why it matters, and what that intervention could look like.
To understand why this matters, we need to return to the thinking behind material and information flow.
Key Leadership Takeaways
- Your organization already holds much of the evidence needed to understand its performance. The difficulty is connecting records scattered across systems and interpreting them in the context of the whole workflow.
- Information flow governs how work moves. Instructions, priorities, approvals, requirements, and feedback can create delays that remain invisible in a conventional process diagram.
- Busy departments do not necessarily produce effective organizational flow. Local productivity can increase while customers wait longer and unfinished work accumulates.
- A visible queue is the beginning of an investigation. The condition creating it may sit upstream, in a management policy, or in the way work is released and prioritized.
- AI can help maintain a living view of the system. Connected evidence makes it easier to visualize constraints, investigate their causes, and design focused interventions.
- Existing OKRs and KPIs should connect to how work actually gets done. Understanding the workflow reveals both the changes needed to achieve the objectives and whether the measures encourage useful decisions.
- Improvement requires action and learning. Leaders must test interventions with the people doing the work, examine their effects across the system, and adjust as conditions change.
What Toyota’s Material and Information Flow Teaches Us to See
Most people encountering Lean will be familiar with value stream mapping. They may even be experiementing with AI value stream mapping. They may have participated in a workshop, drawn a current-state map, identified waste, and produced a future-state picture. What those exercises reveal depends heavily on the depth of the investigation behind them.
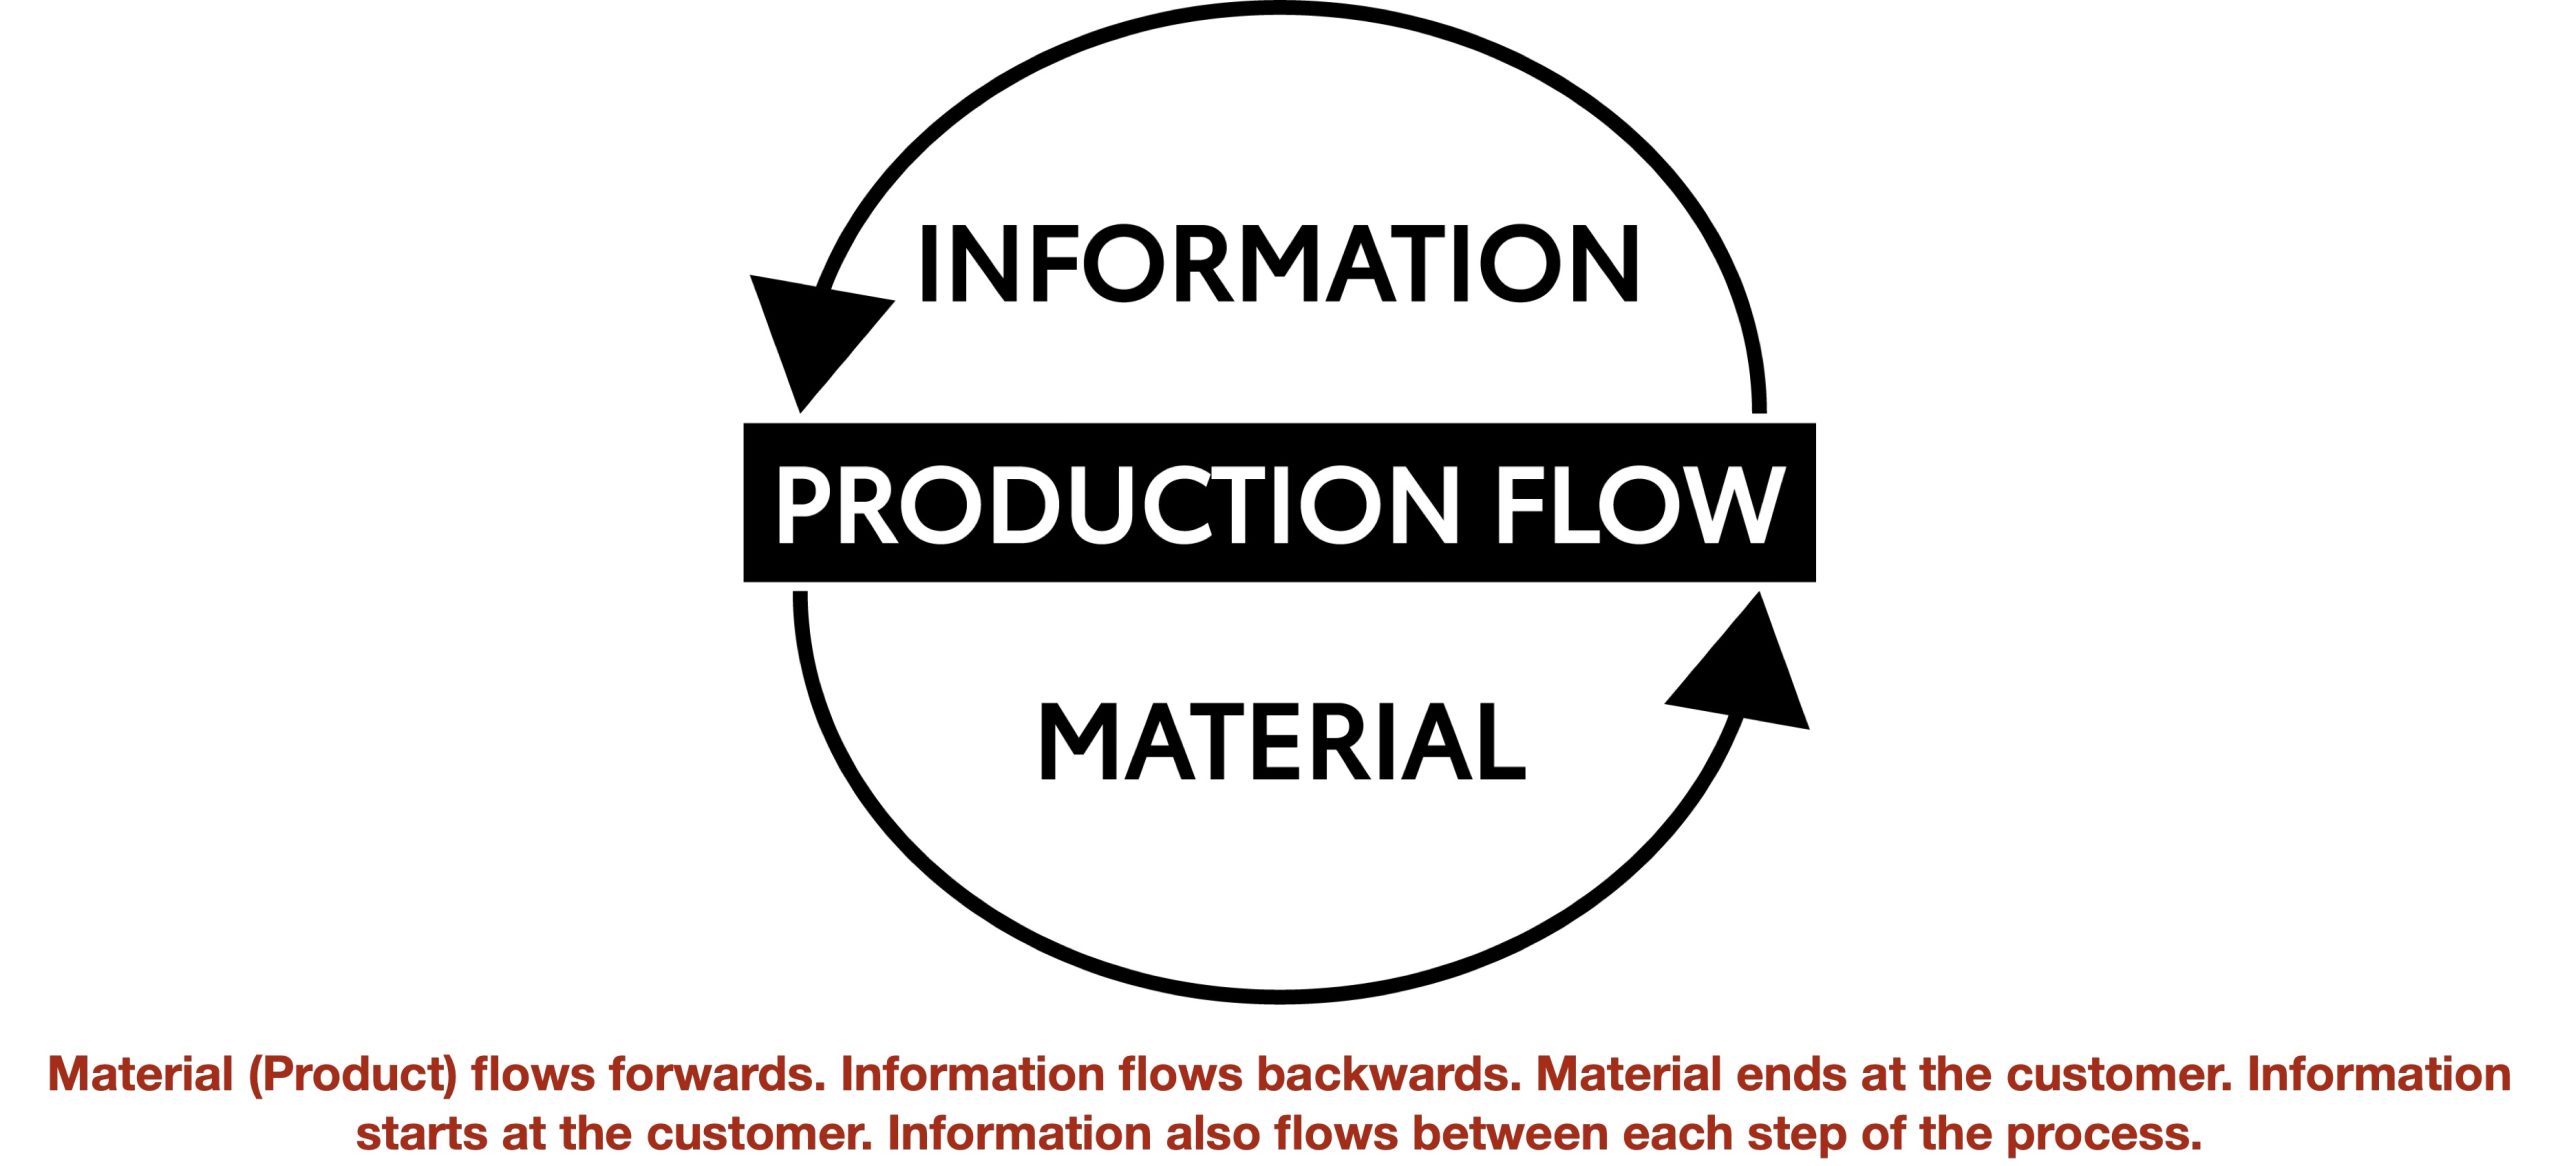
At Toyota, the underlying language is material and information flow. The diagram makes visible the movement and stagnation of material, together with the information that directs its movement. This practice is the foundation of what became widely known as value stream mapping. Properly applied, value stream mapping retains that relationship between the work and the information governing it. Lean Enterprise Institute: Value Stream Mapping
The distinction I am drawing is between that depth of analysis and the simplified mapping exercises that frequently pass for it.
A process flowchart is useful for showing a sequence of activities, decisions, and routes. Material and information flow analysis investigates how the work actually progresses through those activities: what authorizes it, how much is released, what determines its sequence, where it accumulates, and what allows it to move again.
The arrows deserve as much attention as the boxes. An arrow can conceal a journey across a building, a transfer between organizations, an overnight batch, an approval queue, or repeated attempts to obtain missing information. Drawing the connection does not explain how that connection functions.
The broader investigation also follows the movement of people and the objects they need to perform the work. Components and finished goods are part of that picture, but so are containers, tools, fixtures, samples, and documents. A person may have to leave a workstation to collect equipment, find instructions, locate material, or obtain a decision. Every such movement has a reason, and some reveal problems in how the work has been arranged.
Where physical movement needs closer examination, we can use supporting layout and movement diagrams alongside the material and information flow map. The purpose is to understand the relationship between the work, the people performing it, the objects they need, and the information that makes progress possible.
Information is particularly easy to overlook because its effects often appear somewhere else.
A missing instruction appears as waiting. An outdated specification appears as a defect. An ambiguous requirement appears as rework. Conflicting priorities appear as interruptions and unfinished work. A delayed authorization appears as material that has stopped moving or a customer request that nobody can complete. Material can be physically available while the work remains unable to proceed. The people may be present, the equipment ready, and the next operation obvious, but the required information or authority is missing.
Consider an assembly waiting beside a machine. The visible condition is a queue. The explanation might be a missing quality release, an unresolved engineering change, or a production instruction that conflicts with the latest customer requirement. Increasing the machine’s speed would leave that condition untouched. This is why information flow must be examined with the same seriousness as physical flow. We need to establish where information originates, who needs it, when it becomes available, whether it is usable, and how changes are communicated. We also need to understand what happens when it is absent or disputed.
My work in Lean and value stream mapping has made these relationships central to how I investigate an organization. I want to know what the work is doing between the activities, what people must do to keep it moving, and which management decisions are shaping that behavior. A technically accurate map can still provide an incomplete explanation. It becomes useful when it helps us understand why the system produces its current results and how its material and information flows need to change.
This Thinking Extends Far Beyond a Production Line
In manufacturing, the material is often easy to recognize. We can see components, assemblies, containers, and finished products. We can observe inventory accumulating and follow the movement of a particular item.
In knowledge and service work, the things moving through the system are less physically obvious. They may be customer requests, engineering changes, purchase orders, insurance claims, financial approvals, software features, or decisions.
They still require information, consume capacity, encounter dependencies, wait for attention, and eventually produce an outcome.
A request sitting in an approval queue is work waiting to move. An engineering change awaiting clarification is blocked work. A customer implementation that cannot proceed because a commercial decision remains unresolved is work in progress, regardless of how many individual activities have been marked complete.
Toyota’s own experience provides a useful example.
At its June 3, 2024 press conference addressing certification irregularities, Chairman Akio Toyoda described joint improvement activities involving Toyota, Hino, Daihatsu, and Toyota Industries. These activities had begun in February and focused on certification work.
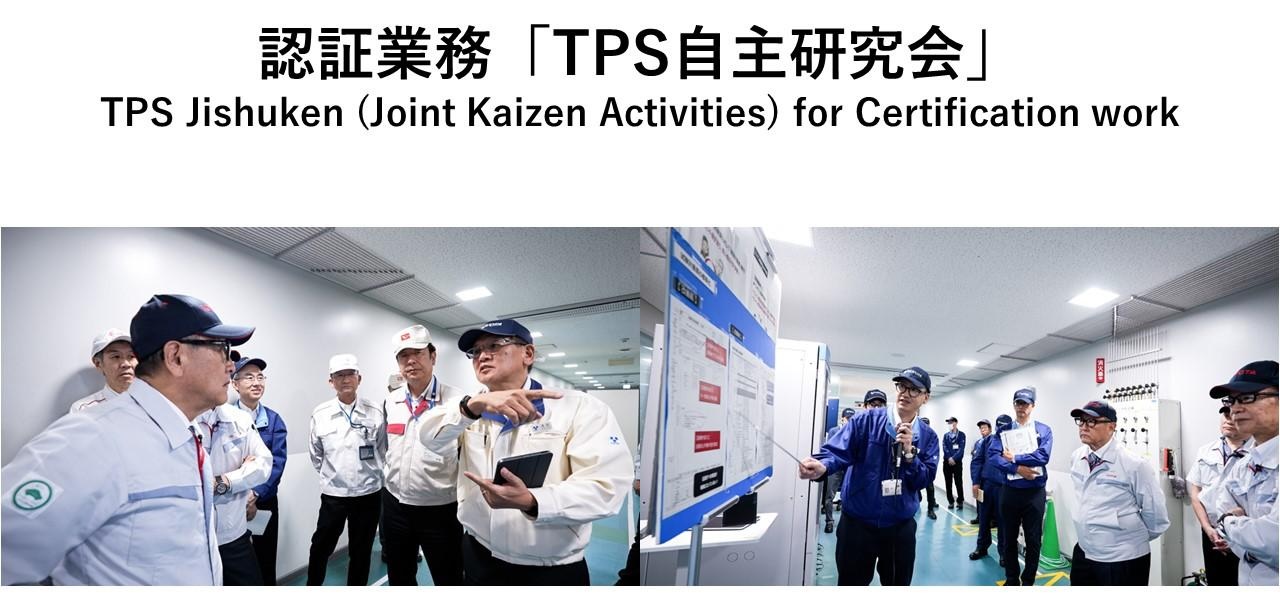
Joint improvement activities involving Toyota, Hino, Daihatsu, and Toyota Industries used material and information flow diagrams to examine certification work. Akio Toyoda discussed these activities at the June 3, 2024 press conference. Image: Toyota Motor Corporation / Toyota Times.
He explained that the group started with the processes most prone to problems and visualized their material and information flow. This exposed issues in the structure of the work. Company presidents, workplace leaders, experienced engineers, and newer employees studied the diagrams together, crossing organizational and hierarchical boundaries. Toyoda also described visiting the workplace himself to check progress and accepting responsibility for following it through. Toyota’s account of its certification improvement activities
The lesson I take from this example is that the method helped people examine how technical and administrative work was organized. Senior management participated in understanding the conditions under which the work was performed.
In certification work, the physical subject of a test is connected to requirements, test instructions, results, records, reviews, and decisions. Following only the physical object would leave much of that work unexplained. Understanding the information and its movement is essential to understanding the system.
The same reasoning applies to a financial approval, a procurement decision, or a customer onboarding process. A problem experienced at the end of the journey may originate in the way information was created, interpreted, transferred, or authorized much earlier.
For an executive, the useful question is how a need becomes a delivered result. That journey may cross several departments and numerous technology platforms. It may involve physical material, digital information, and human decisions at different points.
Following that journey helps leadership understand how the organization’s work connects and where its structure is preventing progress.
Why My Toyota Background Matters to This Work
My approach to these questions has been shaped by working inside Toyota, including serving as Toyota’s Chief of Agile , and subsequently applying and developing that experience with subsequent clients.
My background matters because understanding flow requires more than familiarity with a mapping technique. It requires understanding the management conditions around the work: how priorities are established, how work is authorized, how problems become visible, how people respond, and how improvement is sustained.
My subsequent work in Lean, Agile and value stream mapping has repeatedly brought me back to those conditions.
A map can show that work waits at a particular point. Understanding why it waits requires investigation. The visible queue may be associated with insufficient capacity, but it may also result from approval policies, batching, incomplete information, conflicting priorities, avoidable rework, or the way demand enters the system.
Those explanations lead to different interventions.
Adding people to a process constrained by a weekly approval meeting may leave the principal delay untouched. Asking a team to work faster may produce more unfinished work if another part of the system is already overloaded. Automating a poorly designed handoff may simply move incomplete information more quickly.
The experience built through Toyota and subsequent client work informs how I distinguish among these possibilities. It also informs the questions I ask before recommending action.
- What is the actual condition?
- What outcome are we trying to improve?
- What is preventing the work from progressing?
- What evidence supports that explanation?
- Which change can we test,
- and how will we know whether it helped?
These questions are central to the capability we have been developing with partners. The technology is being shaped by an established understanding of work, management, and improvement.
My contribution is to bring that operational understanding into the design of the capability: the questions it asks of the data, the relationships it examines, and the interventions we develop from the findings. Our partners bring the engineering expertise to make that analysis repeatable across business systems. This connects the knowledge used to investigate and improve work with the technology needed to maintain a living view of it.
Moving Beyond the Workshop and the Report
Value stream mapping can be a powerful learning experience. Bringing people together to follow work across departmental boundaries often exposes differences in understanding that have remained hidden for years.
- One department believes a handoff is complete when it sends a request.
- Another considers the request usable only after several missing details have been supplied.
- A reported processing time excludes the days spent waiting for someone to begin.
- A “completed” item still requires another approval before the customer receives anything.
The discussion involved in discovering these differences is valuable. It creates shared understanding and gives people a basis for improvement.
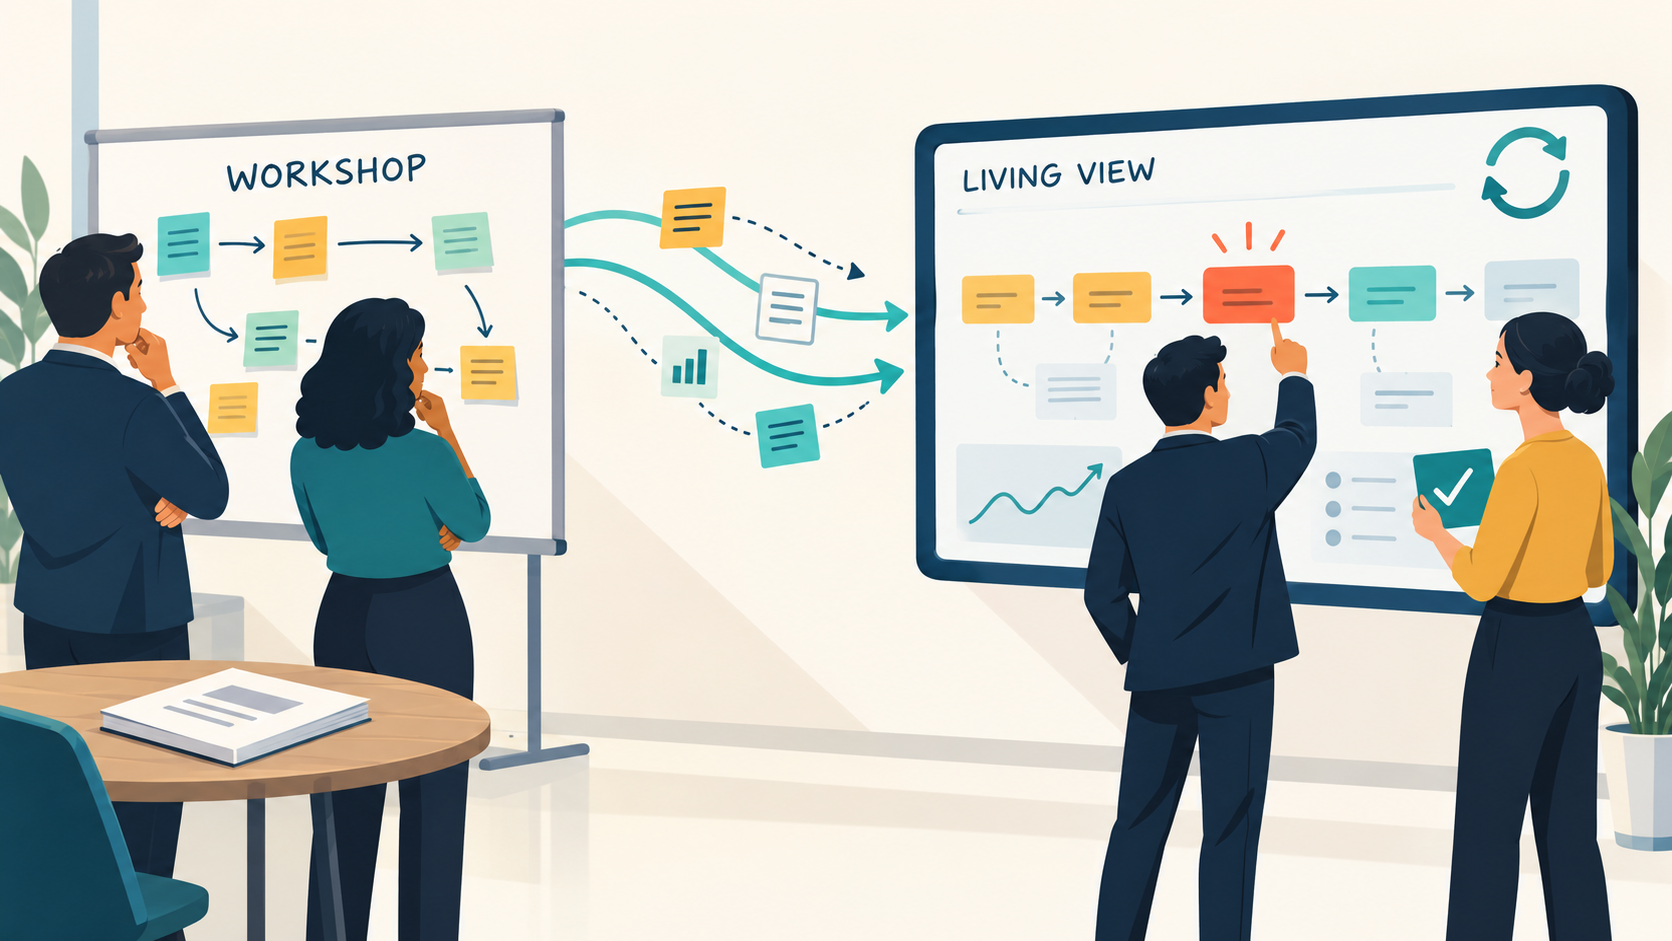
However, maintaining that understanding presents a challenge.
- The organization continues to change after the workshop. Demand varies.
- Priorities shift.
- New work enters.
- Experienced people move.
- Dependencies become more complicated.
- A queue that was small during the mapping exercise grows over the following month.
A periodic map captures a condition at a particular time. Keeping it useful requires repeated observation, analysis, and updating.
This is where the digital evidence already held by the organization becomes especially valuable. It can help us follow the changing condition of the work and revisit our understanding regularly.
AI extends our ability to examine that evidence at a scale and frequency that would otherwise require considerable analyst effort. It can help connect histories, identify patterns, investigate exceptions, and explain what has changed.
The opportunity is a living view of organizational flow: a regularly updated picture that supports ongoing investigation and intervention.
Your Systems Each Hold Part of the Explanation
Consider the technology landscape of a typical organization.
- The CRM system records what was promised to a customer.
- The ERP system records orders, purchases, costs, and transactions.
- A manufacturing execution system records production activity.
- A warehouse system records movement and fulfillment.
- A service desk records problems that customers encounter.
Project management and agile lifecycle management platforms hold another part of the picture. Jira, Azure DevOps, Rally, and similar tools record work items, status changes, assignments, and completion. Other systems hold approval histories, delivery events, quality results, staffing information, and contractual commitments.
Each contains evidence about work. Their individual reports are usually bounded by the application and the way its records are organized.
Following the work across those boundaries reveals a different picture.
A delivery team may report that a feature is complete, while release records show that customers could not use it until much later. A service desk may contain repeated incidents associated with work that appears successful in the original project report. A customer commitment may carry commercial consequences that are invisible to the team prioritizing the work.
The data has survived. Its relationship to the rest of the system has become difficult to see.
Connecting that evidence allows us to investigate the whole journey. We can examine where time accumulates, which handoffs repeatedly create problems, how rework returns to the system, and whether the way work is being prioritized supports the outcomes leadership expects.
This builds on the investments the organization has already made in its technology.
AI Value Stream Mapping Requires More Than Connected Applications
Connecting systems is necessary, but the meaning of their records also matters.
- What does “started” mean in this workflow?
- Does “done” mean that an internal activity has finished, that the work has been approved, or that the customer has received the result?
- Is a reopened item genuine rework, an administrative correction, or a new request attached to an old reference?
Two departments may use the same status label to describe different conditions. One may update records as events happen; another may update them at the end of the week. Some work may move through several systems under different identifiers.
These differences affect the conclusions we can draw.
This is where our practical knowledge of Lean, Toyota’s material and information flow, and organizational systems contributes directly to the capability. We work to establish how the records relate to the actual work, what the important boundaries are, and which measures help explain its movement.
That understanding enables more useful analysis than simply assembling existing reports on a single screen.
We can investigate the difference between time spent working and time spent waiting. We can distinguish a local completion from delivery of the intended outcome. We can examine how a decision made in one part of the organization creates consequences elsewhere.
The depth comes from connecting operational evidence with an understanding of how the system functions.
Making Constraints and Bottlenecks Visible
When work slows, the response is often to increase pressure on the people closest to the delay. They are asked to improve productivity, provide more detailed status reports, or commit to a faster completion date.
A connected view helps us examine what is actually limiting progress.
There is a useful connection here with Eliyahu Goldratt’s Theory of Constraints. Its central contribution is to focus improvement on what limits the system’s ability to achieve its goal. Improving an individual activity matters to overall delivery when that improvement addresses, or supports, the condition constraining the system. TOCICO: Theory of Constraints
Toyota’s material and information flow thinking and the Theory of Constraints have distinct histories and methods. They offer complementary ways to challenge the assumption that improving every department’s local performance will necessarily improve the performance of the whole.
A simple illustration makes the issue clear. Suppose an upstream activity can prepare 100 complete requests each week, but a required specialist review can handle only 60. Assuming demand is sufficient and every request requires that review, increasing preparation to 120 requests does not increase completed delivery. It increases the work waiting for review.
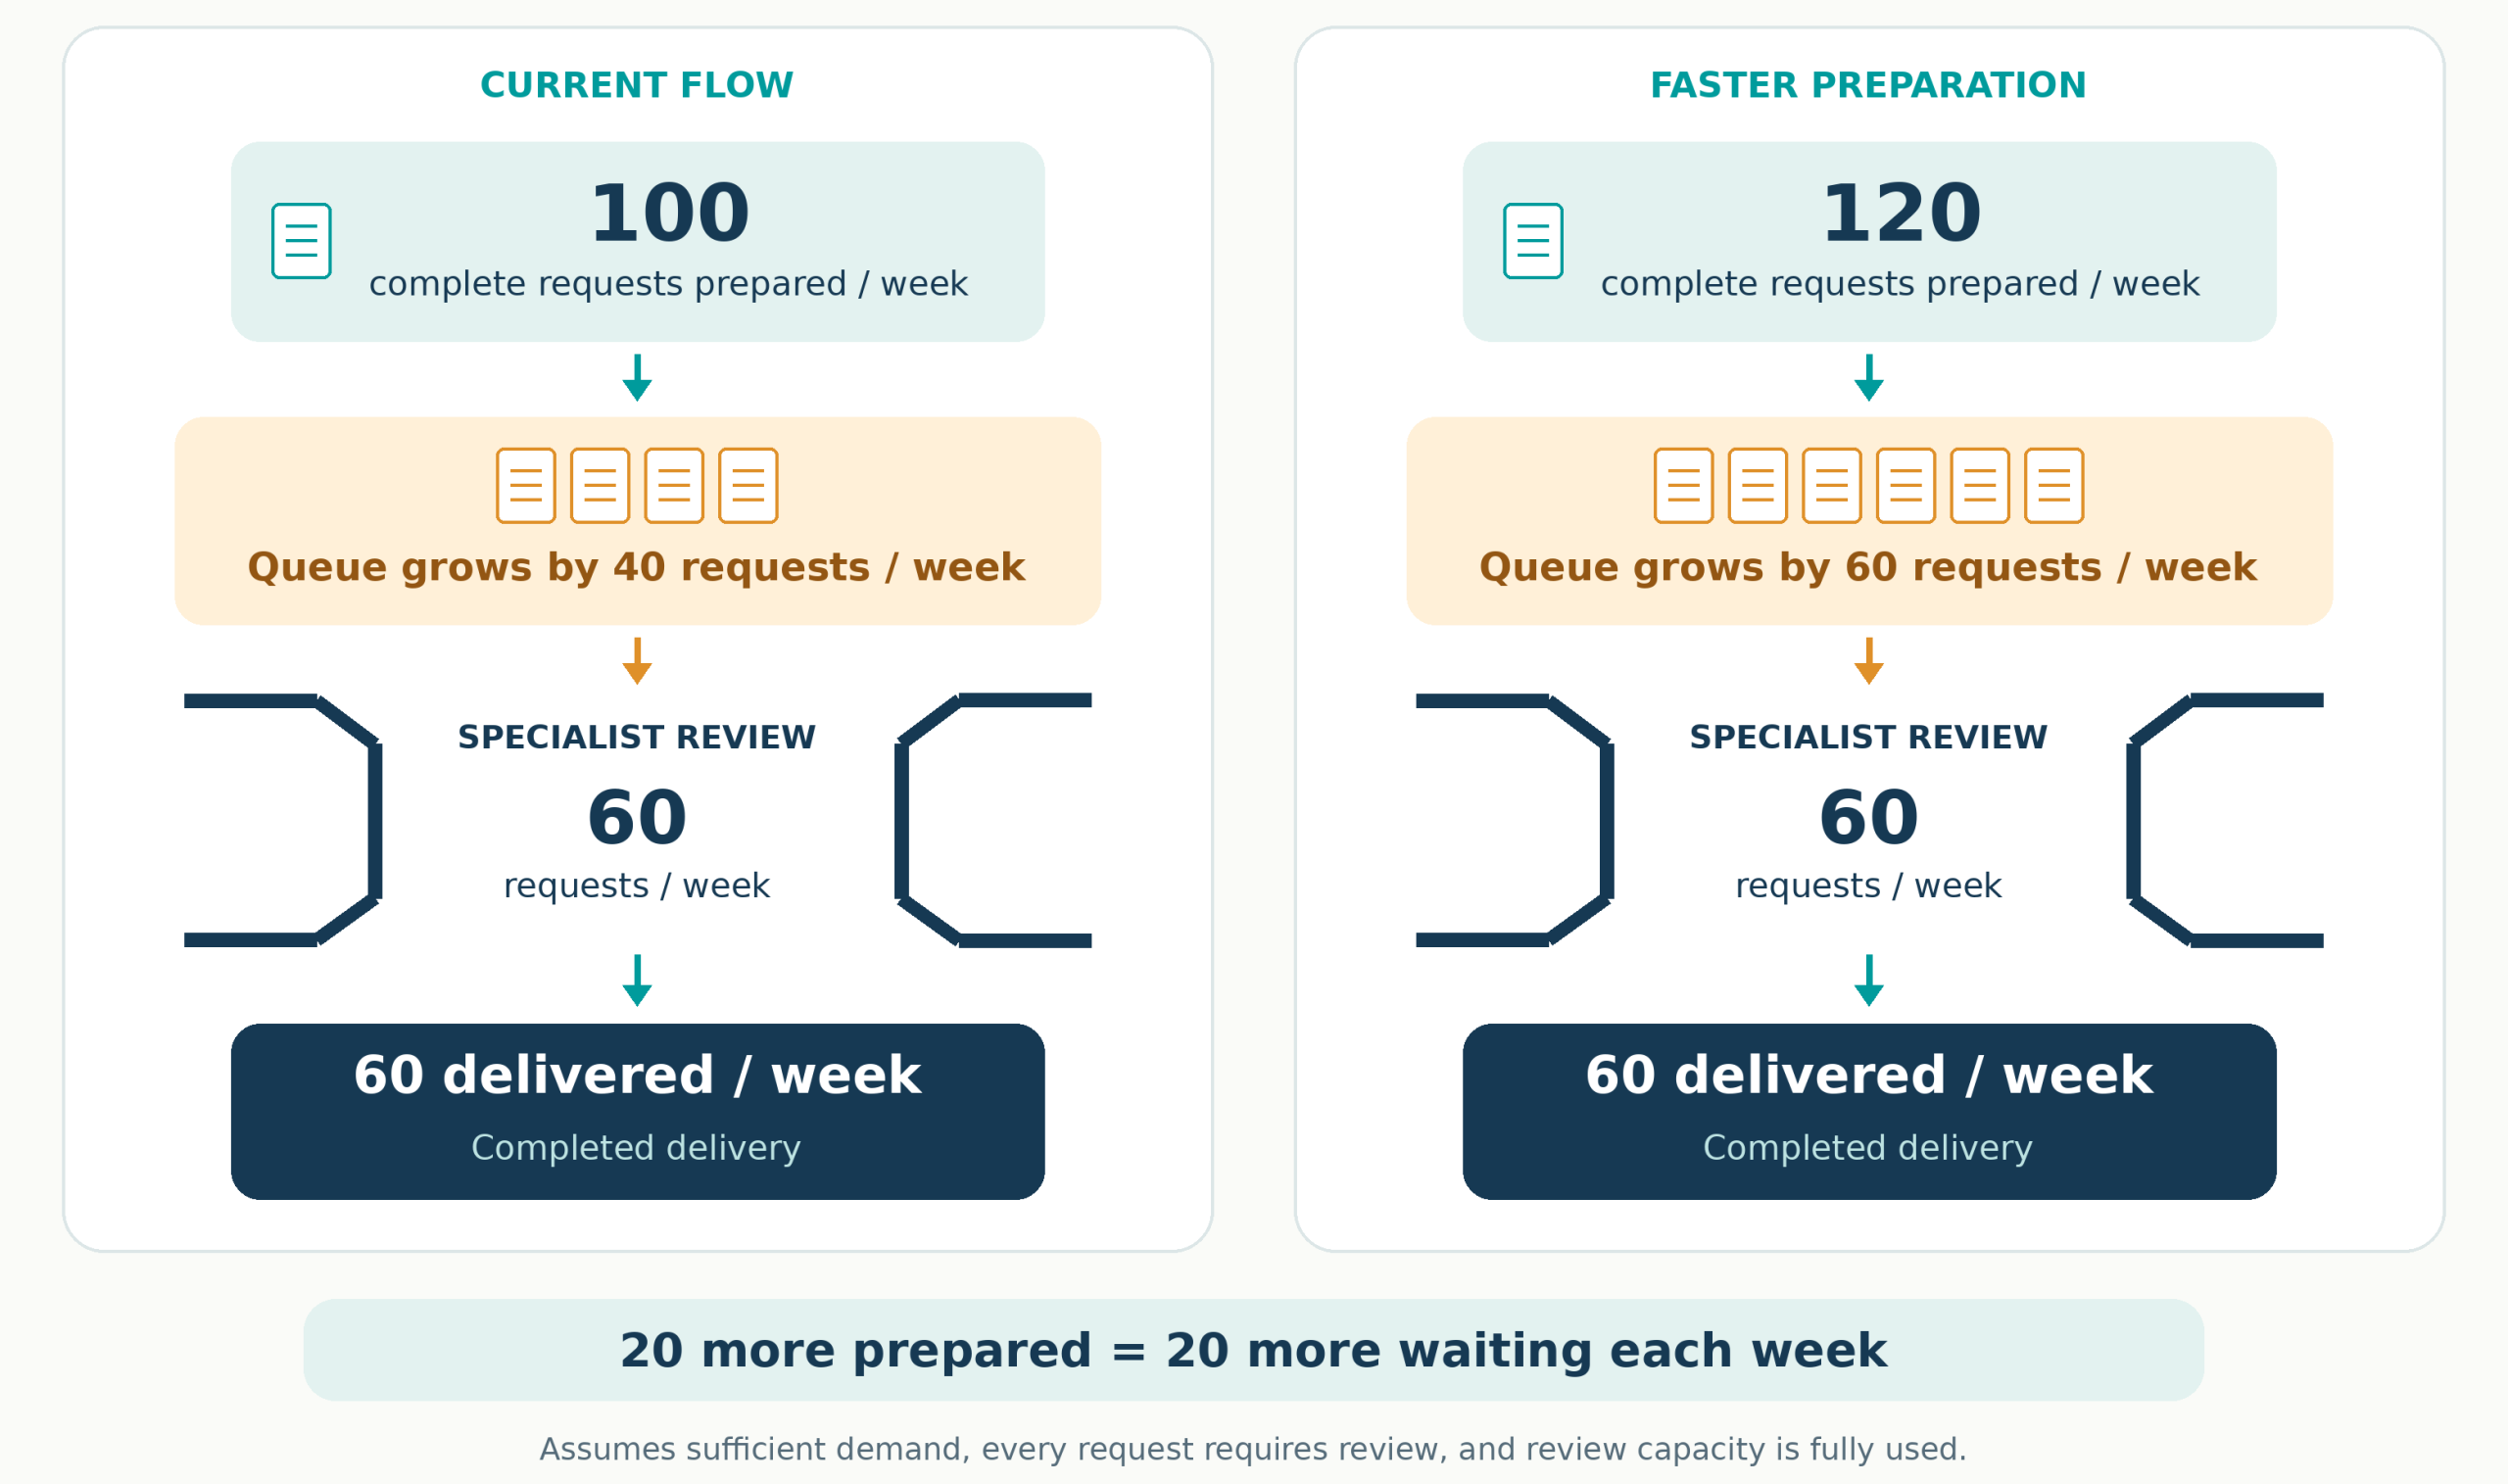
Queueing theory helps explain the consequences. Little’s Law relates average work in progress, throughput, and time in the system under stable conditions. Kingman’s approximation shows how waiting time rises sharply as utilization approaches full capacity, particularly when arrivals and processing times vary. In this example, arrivals already exceed review capacity, so the queue keeps growing. You start more work, finish no more, and leave requests waiting longer. If the additional workload also creates more interruptions, task switching, and rework, completed delivery can fall.
The management question becomes how to improve the flow through the limiting stage and arrange the surrounding work to support it.
This can mean protecting specialist time from avoidable interruptions, ensuring requests arrive complete, reducing repeated handling, or changing how work is released. Additional capacity may be necessary, but examining how existing capacity is consumed should inform that decision.
We also need to distinguish a visible bottleneck from the wider conditions creating it. A queue can result from limited capacity, but it can also reflect batching, variable arrivals, incomplete information, conflicting priorities, or a policy that permits work to move only at particular times. The largest queue on a dashboard does not, by itself, prove that we have identified the system’s governing constraint.
Suppose a specialist review stage has a growing backlog. Further examination reveals that many requests arrive incomplete, are returned for clarification.
Explaining Why, and Designing What to Do Next
Identifying a problem is only part of the job. Leaders need a usable explanation and a practical response.
A dashboard that says delivery time has increased tells management that something changed. A more useful view shows where the additional time accumulated, which types of work were affected, what other conditions changed, and how those conditions connect.
That is the level of understanding we are working to make accessible.
For example, the evidence may show that work entering with incomplete requirements experiences more clarification, more handoffs, and more rework. The visualization can make that route visible, allowing leaders to understand why the overall journey takes longer.
The intervention can then be designed around the conditions creating the delay. That may involve changing the information required before work begins, establishing a faster route for resolving ambiguity, or bringing the people responsible for a recurring handoff into the same discussion earlier.
In another situation, the evidence may reveal excessive work in progress spread across several competing priorities. The intervention may involve reducing the amount of work started, changing the sequencing of demand, or protecting capacity needed to finish existing commitments.
The aim is to make the next management decision concrete:
- Where should we intervene?
- What condition are we trying to change?
- Why do we expect that change to help?
- Who needs to participate?
- What evidence will show whether flow improves?
This supports rapid, focused interventions. We can test a change at the relevant point in the workflow, observe its effects, and adjust it as we learn.
The analysis can explain recorded patterns and identify likely causes. Understanding those causes fully still requires engagement with the people doing the work. That combination produces stronger decisions than either a dashboard or a workshop can provide on its own.
Visualization Helps Leaders Understand the System
Executives need to understand the operational significance of the evidence without having to reconstruct it from hundreds of individual records, or worse, pay consultants to do that for them, often weeks after the intervention should have been executed.
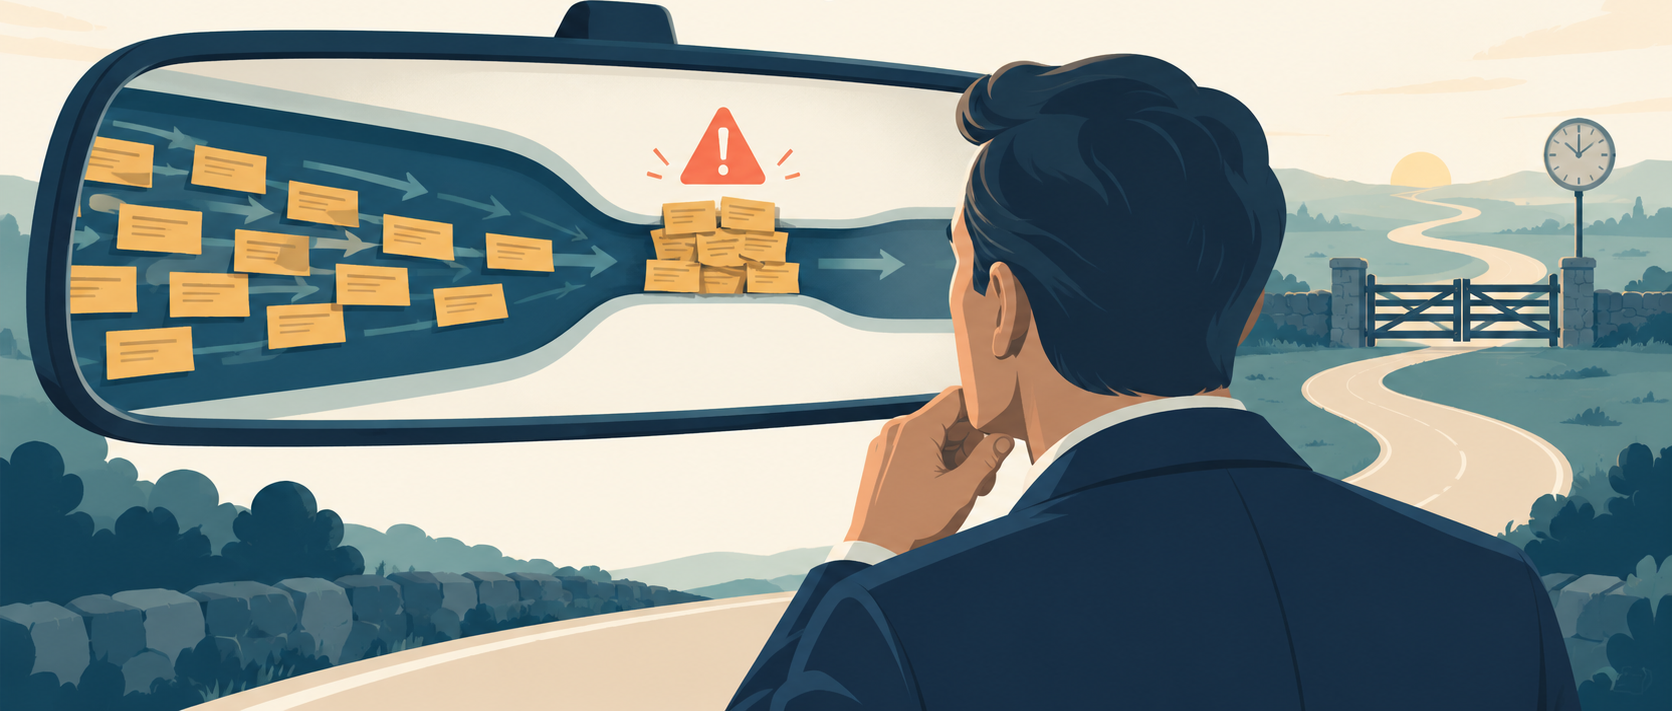
Hindsight is cruel, and not always that useful.
A useful visual view shows how work moves, where it accumulates, and how the condition changes over time. It makes the relationship between a queue, a handoff, a decision, and a customer outcome easier to examine.
Leaders should be able to move from the overall picture to the evidence behind a particular concern. If a delay is highlighted, they should be able to see which work contributes to it. If an intervention is proposed, they should be able to understand the reasoning and assumptions behind it.
Plain language is key.
A leader needs an explanation such as: “Requests are waiting for approval because they arrive in weekly batches, and the approval stage cannot clear each batch before the next arrives.” That explanation connects a visible condition to a potential change in how the system operates.
The same view can help people across departments develop a shared understanding. Sales, operations, finance, and technology can examine the same journey and see how their decisions interact.
This makes it easier to design an intervention that improves the end-to-end outcome, rather than shifting a problem from one department to another.
Work with Existing OKRs and KPIs, Then Examine Their Fitness for Purpose
Organizations already have objectives, key results, and performance measures. These express what leadership is trying to achieve and how progress is currently being judged.
Start with existing OKRs and KPIs.
The first task is to understand their definitions and intent, then connect them to the workflows through which the organization must achieve them.
Suppose an objective is to improve customer onboarding, with a key result to reduce the time required for a customer to become operational. The connected view may reveal that most elapsed time sits between verification, approval, and activation.
Each department may be meeting its own processing target. The delay exists in the way the work passes between them.
That evidence reveals the workflow changes needed to support the objective. It also helps management use its KPIs more effectively. Leaders can see which measures explain progress toward the outcome and which describe only a local activity.
As the flow becomes visible, we can examine the measures themselves.
Does a completion metric correspond to something the customer can use? Does an average turnaround time conceal a group of requests that have been waiting far longer? Does a utilization target encourage more work to start while unfinished work continues to accumulate?
A measure can be accurately calculated and still encourage the wrong decisions.
Our work therefore includes examining the fitness for purpose of the existing measures and identifying where they should be refined or supplemented. This may mean adding visibility of queue age, rework, successful delivery, or elapsed time across an important handoff.
The essential connection is between the intended outcome, the way work flows, and the decisions the measures encourage. Making that connection visible gives leadership a stronger basis for achieving its OKRs and using its KPIs.
How This Differs from a Conventional Consulting Engagement
The difference in our approach lies in how operational knowledge, technology, and intervention are brought together.
A conventional engagement can devote substantial effort to collecting information, reconstructing the current condition, and preparing a report. By the time the findings are discussed, the organization may already be operating under different conditions.
Our aim is to make the evidence regularly available and use our expertise to interpret it, challenge assumptions, and help design changes.
The Toyota and Lean experience informs what we look for. Subsequent client work informs how we apply that thinking across different operating environments. Our specialist partners contribute the engineering and AI capabilities needed to connect and interrogate the evidence.
Together, these capabilities support a continuing relationship between understanding and action.
The organization can see a problem, examine its contributing conditions, design an intervention, and return to the evidence to understand what happened afterward. The knowledge gained from that cycle informs the next decision.
This is the practical contribution of the work we have been developing: making the system easier to understand and the next improvement easier to act upon.
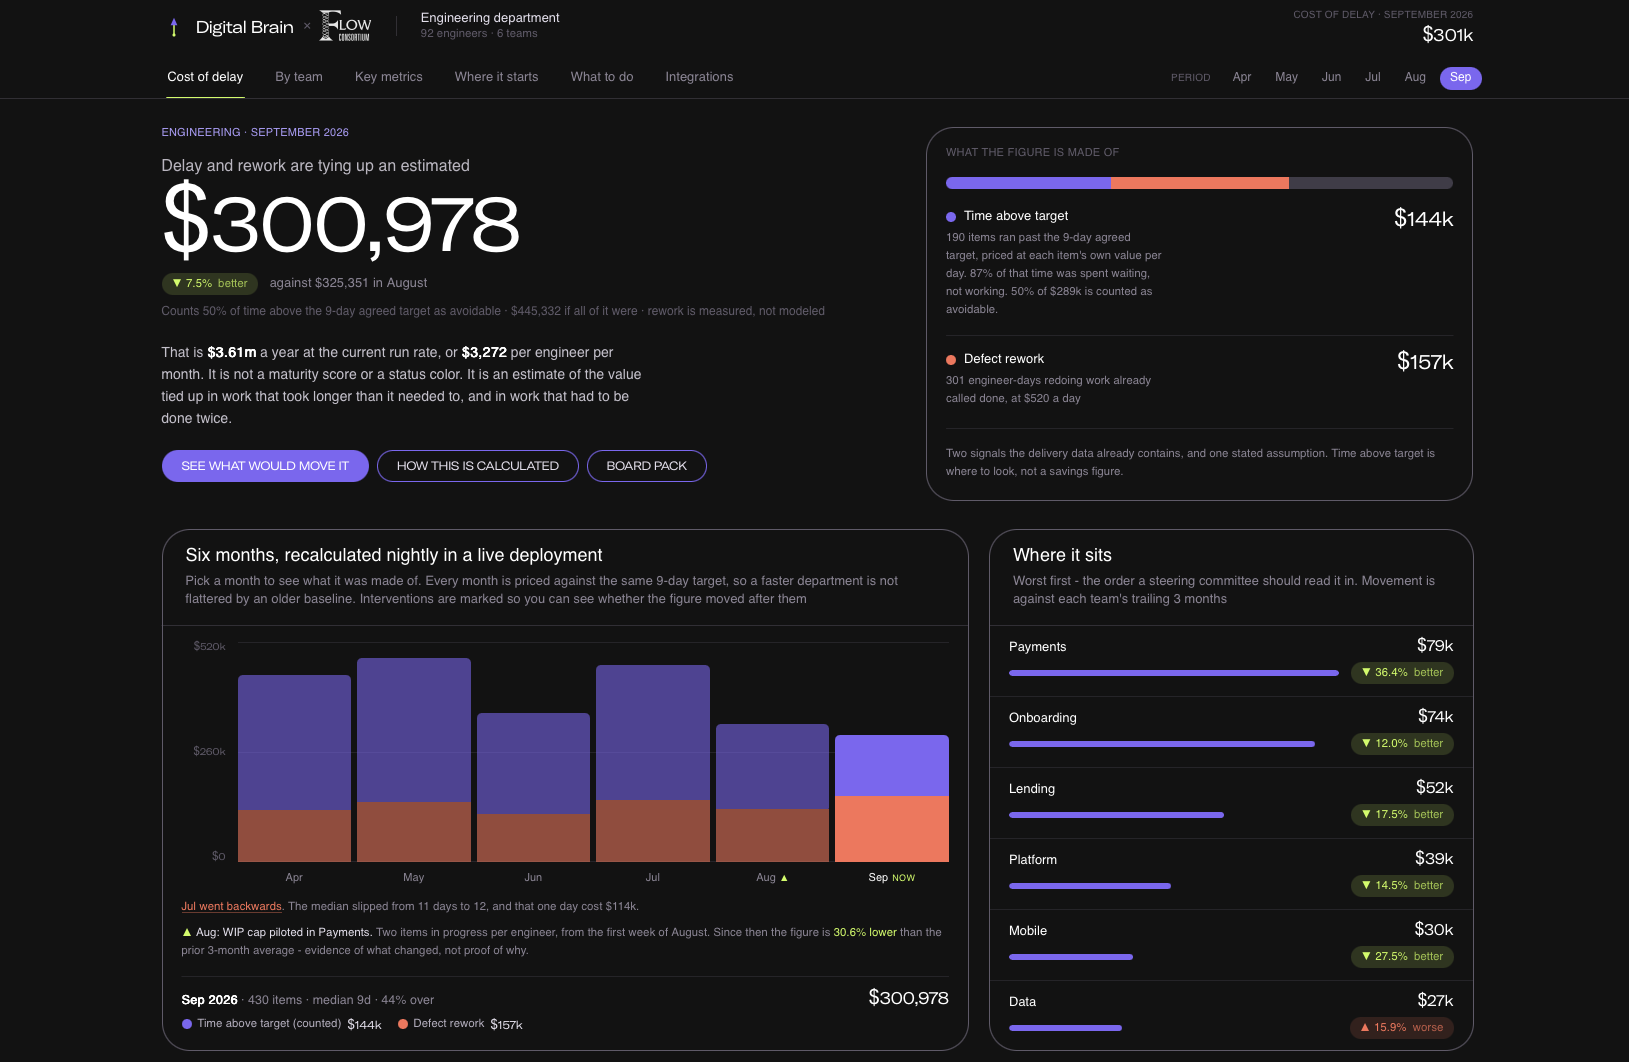
Example dashboard visualizing and quantifying where and how much your delays and rework are costing you right now, in real-time.
Applying This Through Digital Brain™
Digital Brain™ connects and interrogates evidence across existing business systems, develops a regularly updated view of the work, and presents findings in language that executives can use. Depending on the workflow and available data, this can include work histories, queues, dependencies, defects, rework, delivery events, financial inputs, and commercial commitments.
Using read-only access to source systems, the analysis builds on the organization’s existing technology and the records already being captured.
Whether the context is manufacturing, supply chains, procurement, customer service, finance, administrative work, and other workflows where relevant data exists, the same approach can be applied. If there is a data trail, it can be interrogated.
One key difference is that Digital Brain™ works across platforms. Individual applications typically report on the work recorded within them. Digital Brain™ connects records from the different systems involved in the same workflow, creating a broader view of how work moves through the organization. We apply material and information flow thinking to interpret those connections, explain where work is constrained, and help design practical interventions.The analysis takes account of the work, the organization’s objectives, its existing measures, and the decisions leadership needs to make.
It can also expose recurring patterns of delay, interruption, or rework that the available records do not fully explain. These patterns may indicate what we sometimes call dark constraints: constraints whose effects are visible while their underlying causes remain unclear. Making those effects visible gives us a more precise starting point for investigation with the people doing the work, helping us uncover the conditions involved and determine where intervention is needed.
The value comes from the combination: visibility of the workflow, an explanation of the conditions affecting it, and practical guidance on where and how to intervene
Better Visibility Should Strengthen Management
No digital representation contains everything that matters.
Some work happens outside the systems. Some information is recorded late. Some patterns require local knowledge to explain. The people doing the work can often identify a missing condition that changes how the evidence should be interpreted.
A living view should make those conversations more focused and productive.
It gives management and the workforce a shared starting point. They can examine the same evidence, test explanations, and agree on an intervention grounded in the actual condition. They can then observe whether the change improves delivery, reduces rework, or helps customers receive what they need.
This is consistent with the improvement thinking that shaped my work at Toyota and continues to shape my work with clients.
We now have a greater ability to connect the evidence an organization already holds and make its operating conditions visible. Used well, that capability shortens the distance between recognizing a problem, understanding why it occurs, and taking informed action.
For leaders, the opportunity is substantial. They can see beyond departmental summaries, understand the work as a connected system, and direct rapid interventions where those interventions are most likely to help.
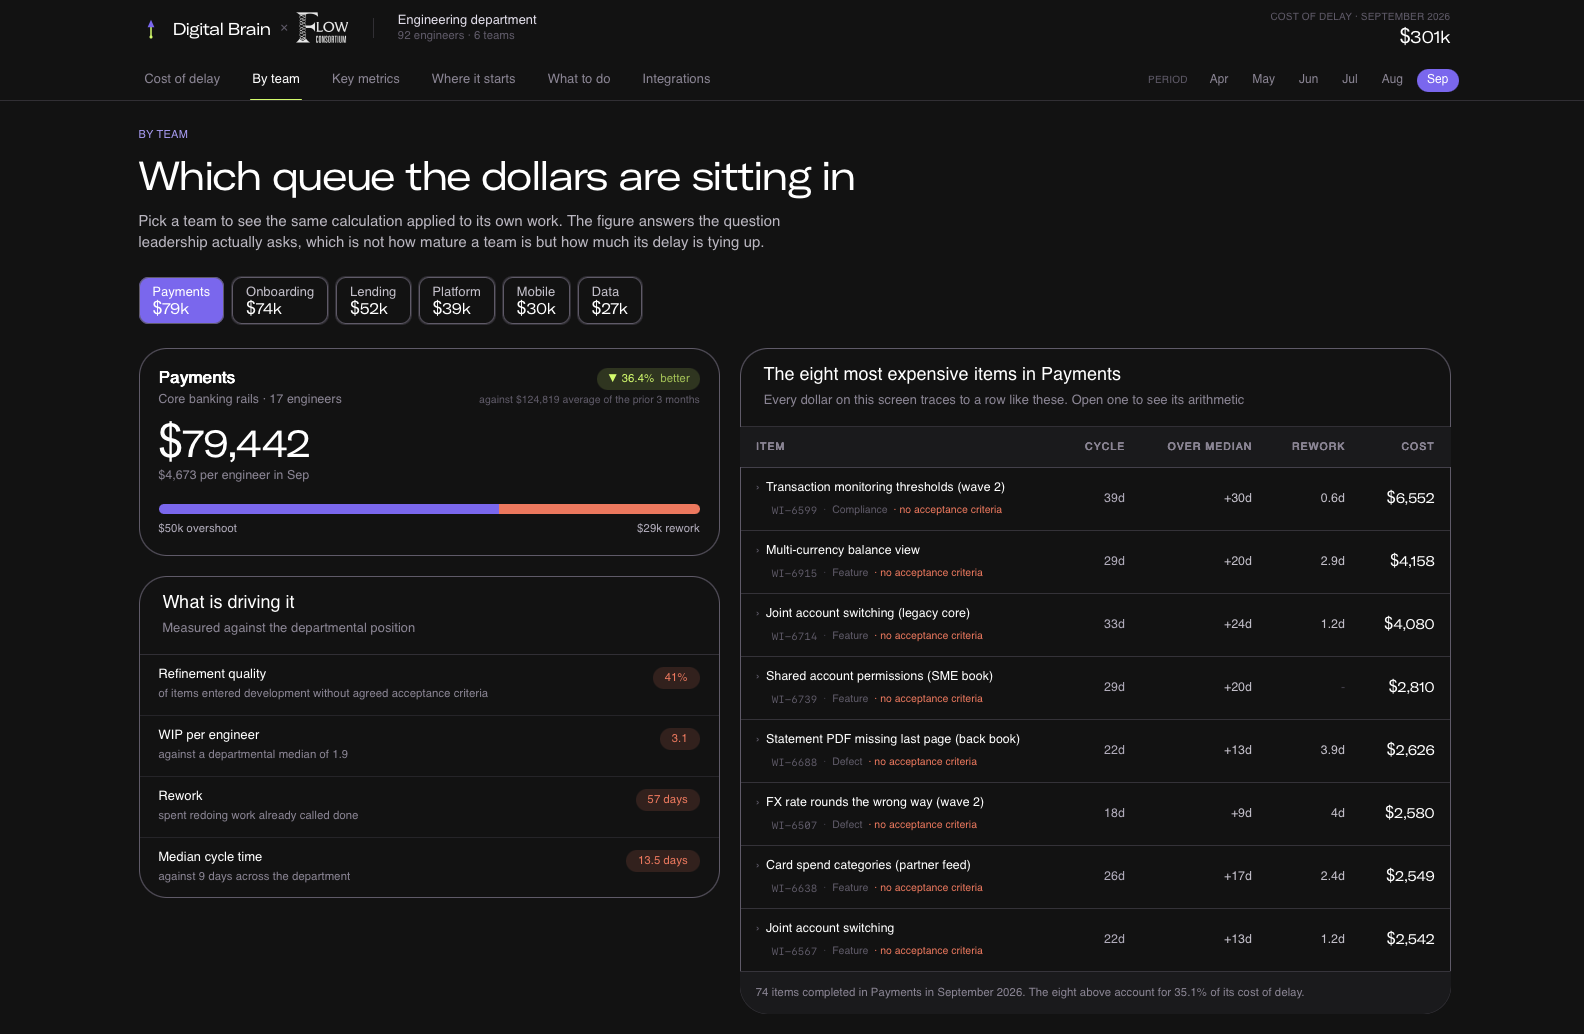
The organization already holds many of the clues. We can now put them together in a way that helps people understand the system, and improve how it works.
Seeing the System Creates a Responsibility to Act
The thinking behind material and information flow asks management to follow the work, understand what governs its movement, and confront the conditions that prevent it from delivering the intended result.
AI gives us a greater ability to maintain that understanding. We can connect evidence across systems, examine changes more frequently, and bring problems into view while there is still an opportunity to intervene.
My work with specialist partners builds on the knowledge developed through Toyota and subsequent client engagements. That experience informs what we look for in the data, how we interpret the relationships we find, and how we help leaders translate those findings into practical changes.
The aim is to make the next decision clearer: which condition needs attention, why it matters, what intervention is justified, and how its effect will be evaluated.
Some interventions will be small. A different approval arrangement. Better information at a handoff. A change to how work enters an overloaded activity. Others will require management to reconsider established policies, priorities, or measures. Their value depends on whether they improve the work and the outcome experienced by the customer.
Visibility alone changes nothing. Leaders must create the conditions in which people can investigate problems, test improvements, and challenge arrangements that no longer serve the organization.
Your systems already hold much of the evidence. Your people hold essential knowledge about what it means. Bringing those together gives management a stronger basis for action.